Analysis

Solana bulls stalled at $170 – Should traders anticipate a move past $200?
Posted:
Journalist
- Solana gave intensely bullish signals but the chances of a reversal can’t be overlooked.
- The OBV moving within a range was a sign that the bullish advance might slow down next week.
Solana [SOL] was trading at the $170 resistance zone that had rebuffed bulls back in late May and early June. A recent report highlighted that a Solana surge to $176 was to be anticipated given the large cluster of liquidity there.
This has come to pass. A daily session close above $175.6 would flip the market structure bullishly. Should traders expect the current rally to go to $200, or will the bears push them back?
The two key resistances overhead
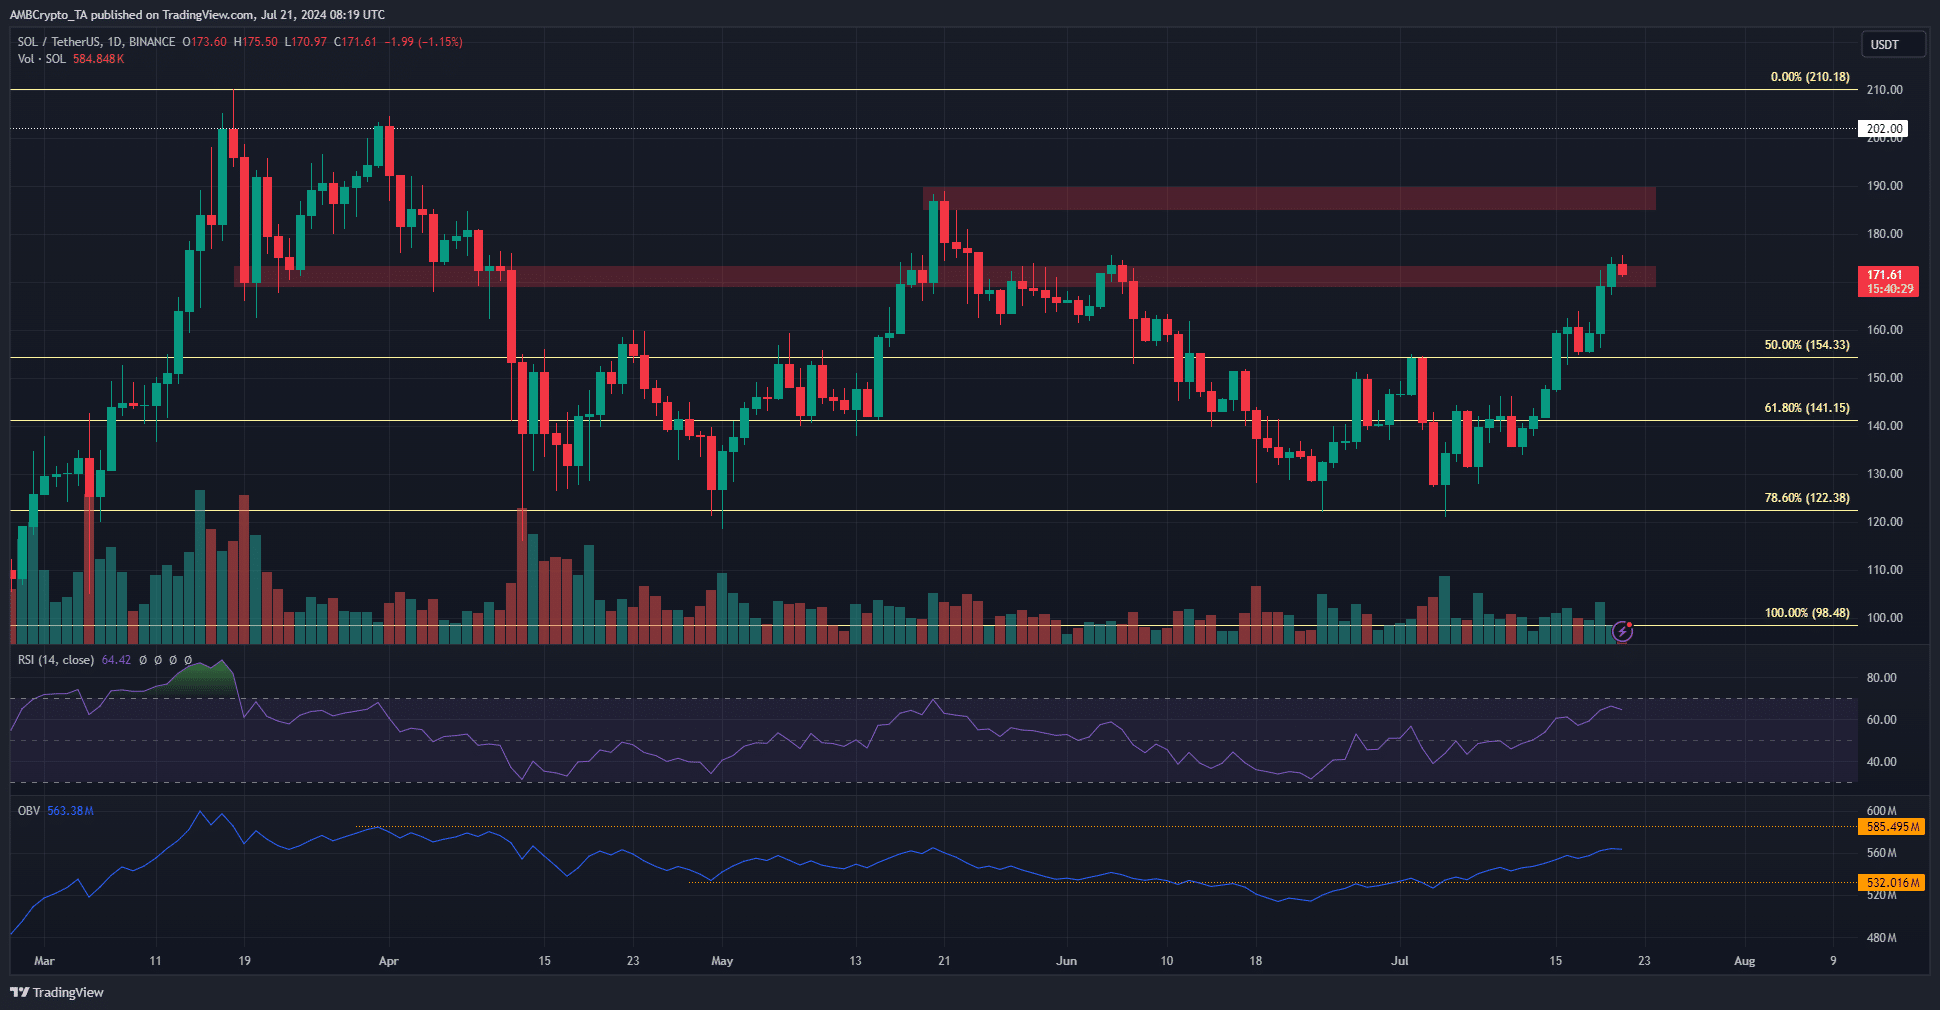
Source: SOL/USDT on TradingView
The $70-$173 zone has served as support, then resistance since mid-March. Above it, the $190 zone was where SOL formed its mid-May high before trending downward in the summer.
The Fibonacci levels showed that, despite the downtrend, the 78.6% level had been defended. Therefore, the higher timeframe bias such as weekly remained bullish. The daily chart was bullish already after the $154 recent high was breached.
The daily RSI indicated bulls were dominant and upward momentum is likely to continue. The OBV was in an uptrend but needs to clear the resistance from late March to signal a breakout past the $170 and $190 levels.
Solana speculator sentiment is firmly bullish
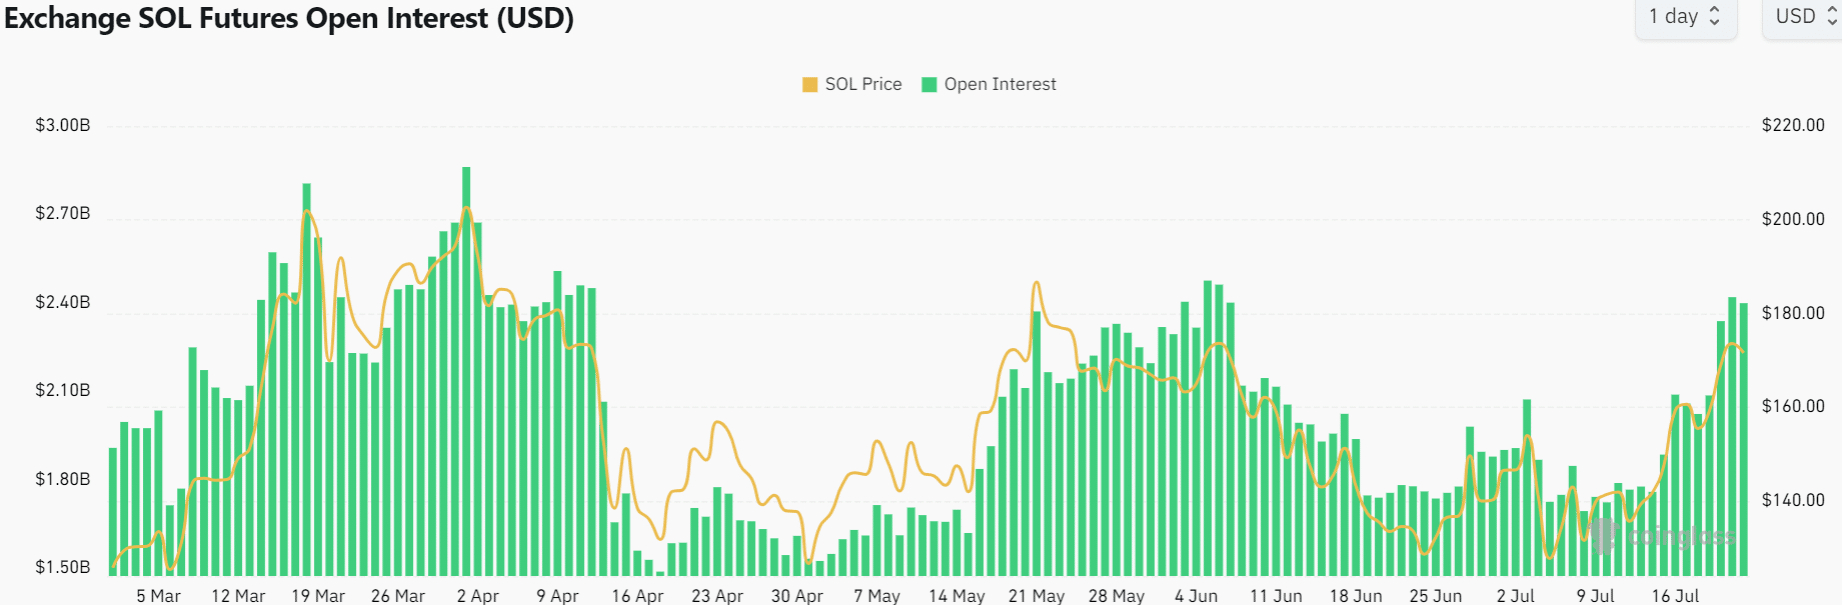
Source: Coinglass
Since the 10th of July, both the price and the Open Interest have climbed quickly. Bullish conviction was strong over the past week and the OI was at $2.4 billion, comparable to the levels from April and early June.
While it is a positive sign, is does not guarantee a breakout.
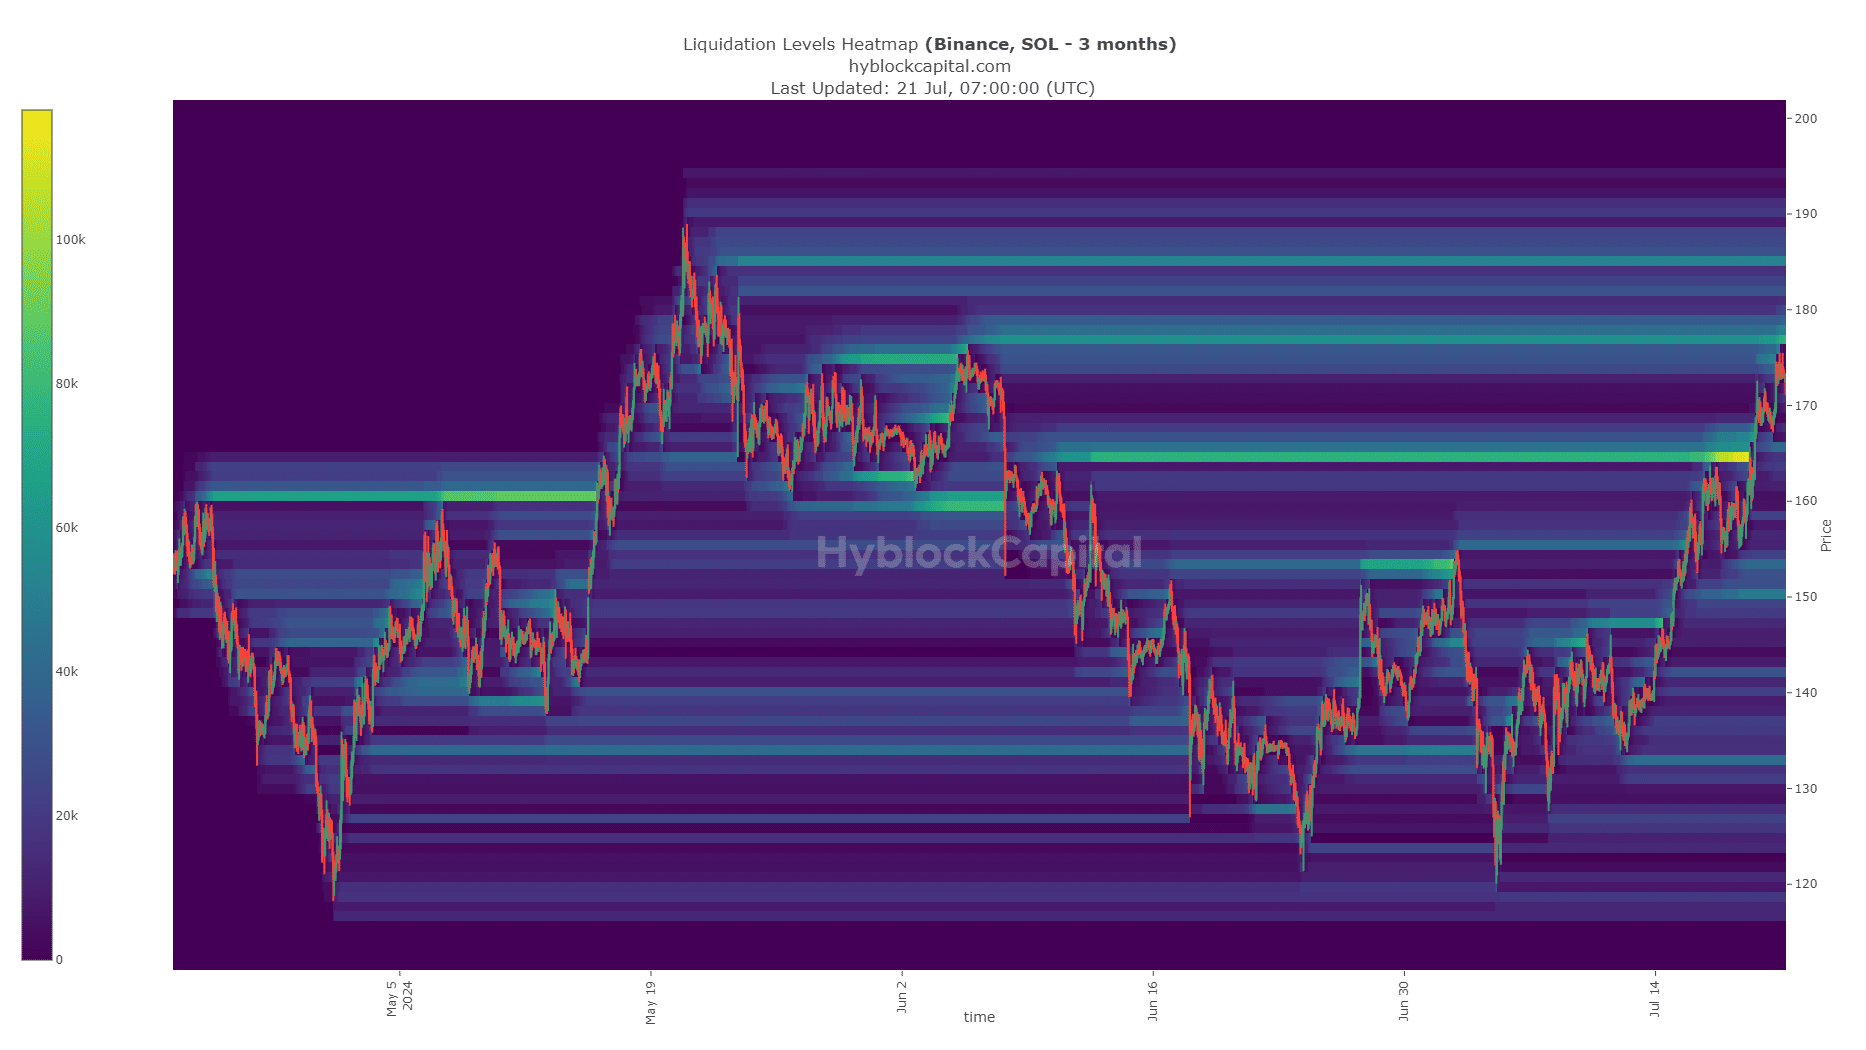
Source: Hyblock
Analysis of the liquidation levels showed that the $164.6 region was a place where a reversal might have happened. Instead, prices rushed higher, which underlined the bullish strength.
Is your portfolio green? Check the Solana Profit Calculator
A similar scenario might occur at the $177 and $185 liquidity pools.
The latter is more likely to see a reversal as bulls might be overextended at that point and there would be a large amount of liquidity that price could claim to the south.
Disclaimer: The information presented does not constitute financial, investment, trading, or other types of advice and is solely the writer’s opinion.