
- Solana was testing a multi-month support level at press time, after persistent selling pressure and a lack of buyer interest.
- Despite weakening price, on-chain data remained positive, with development activity on Solana soaring 33% month-on-month.
Solana [SOL] was down by nearly 4% in the last 24 hours, with the bearish trend across the broader cryptocurrency market influencing further headwinds. The token was trading at $139 at the time of writing.
SOL has posted the largest drop among the top ten largest cryptos by market capitalization. Trading volumes are also down by 12% per CoinMarketCap data, suggesting decreased market interest and a lack of conviction among traders.
As Solana tests a multi-month support level, is a bullish reversal imminent, or will the bearish trend continue?
Diminished buyer interest
Solana’s technical indicators are hinting at a lack of buyer participation. The Chaikin Money Flow (CMF) on the four-hour chart has been oscillating in the negative region since early this week.
This trend indicated persistent selling pressure and a lack of adequate buyer interest to absorb the tokens that have been dumped into the market.
The weak buying momentum around SOL is also seen in the Relative Strength Index (RSI). The index was at 33 at press time, meaning that a bearish momentum was at play.
The RSI has been forming lower lows over the past week, showing bears have the upper hand. However, the RSI line was now attempting to make a bullish crossover above the signal line.
The potential crossover has also coincided with two consecutive green candles after the price bounced after testing multi-month support at $138. Solana has held this support level since mid-August.
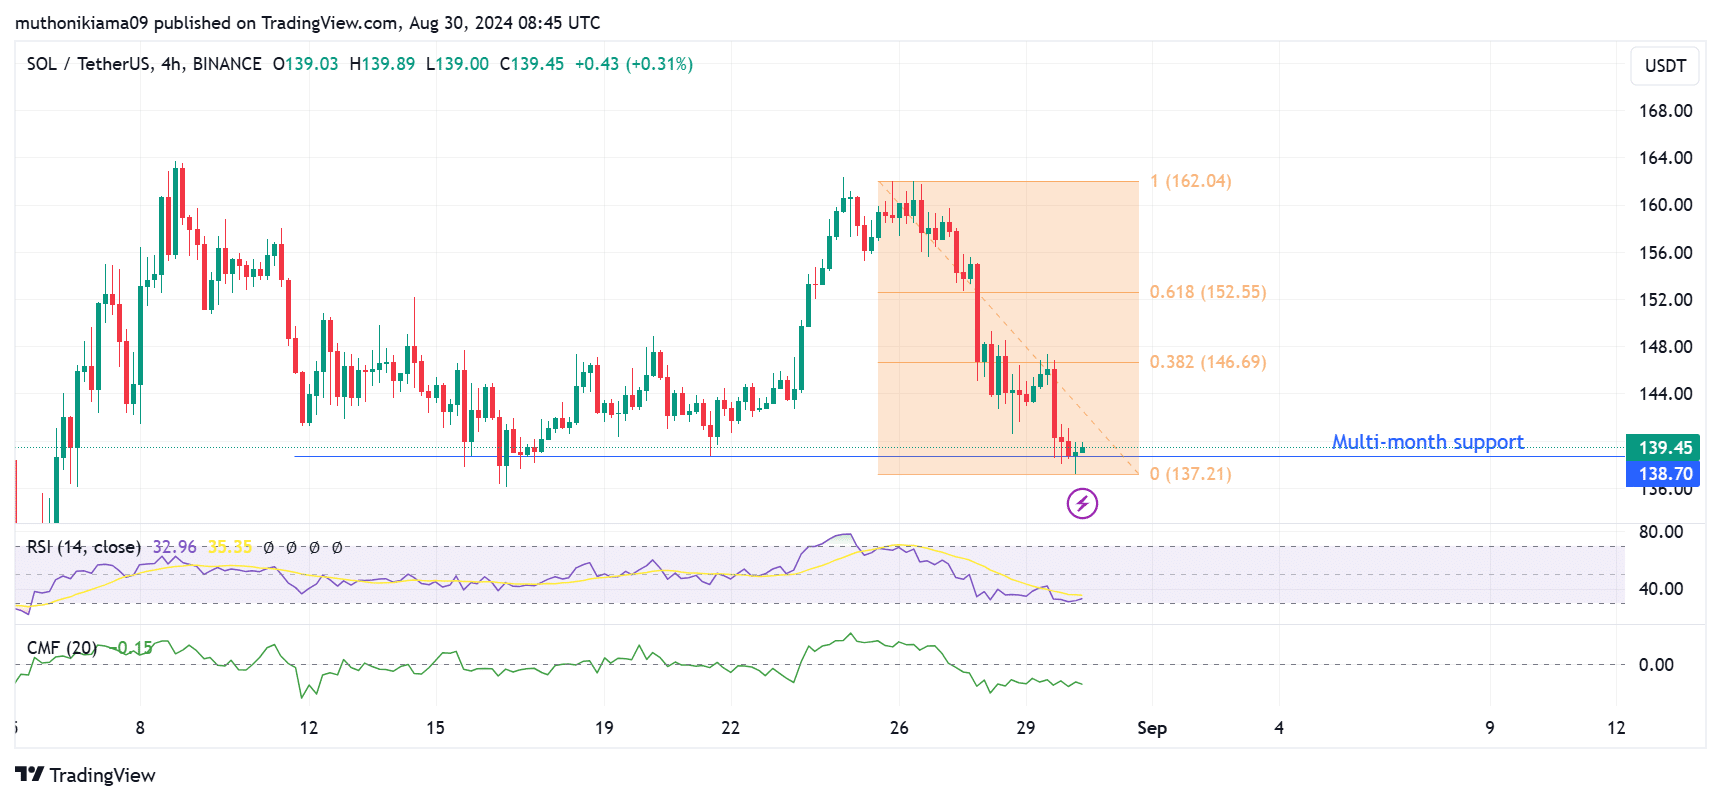
Source: TradingView
If Solana bounces from this support as it has done in the past, bulls will target the immediate resistance at the 0.382 Fibonacci level ($146).
The other key level to watch is $152 as SOL needs to break above this price to confirm an uptrend. If the uptrend fails, SOL could consolidate and trade within a range before deciding on the next trend.
Solana shows strength
While the price action remains bearish, Solana’s on-chain metrics painted a bullish picture.
According to a recent X (formerly Twitter) post by Santiment, the Solana network has posted the highest month-on-month rise in total development activity.
This activity soared by 33%, which is a positive sign of the network’s growth and improvement.
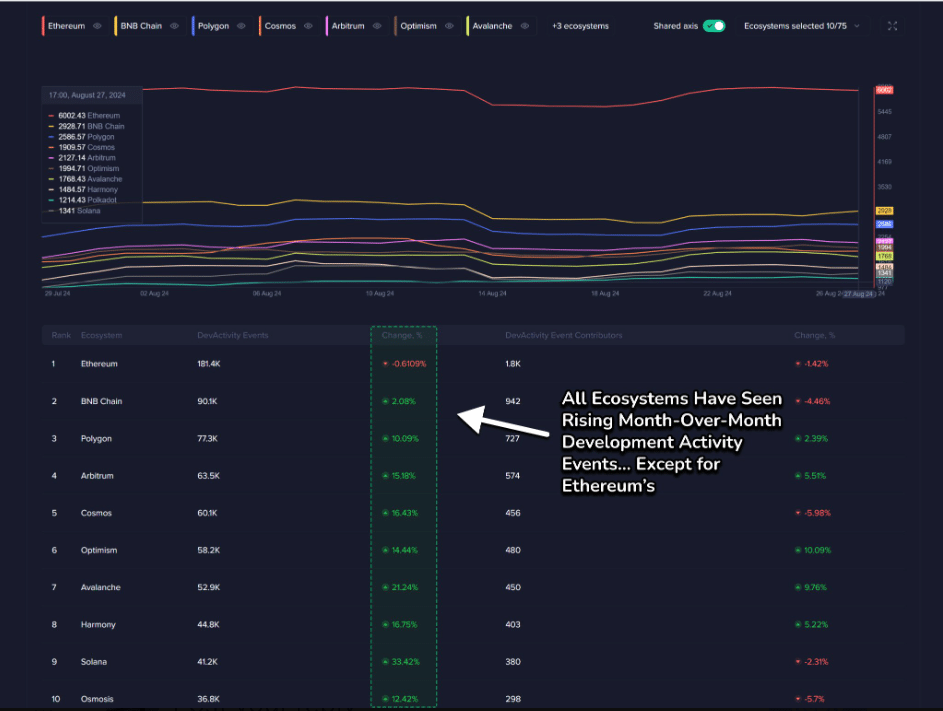
Source: X
Data from DeFiLlama also showed an over $1 billion increase in Solana’s Total Value Locked (TVL) over the past month, despite the price headwinds.
Read Solana’s [SOL] Price Prediction 2024–2025
Nevertheless, the positive network metrics were not doing much to convince long traders.
Also, the Long/Short Ratio below 1 on Coinglass showed that short traders have been dominating Solana’s price action for most of the week.