Solana, EOS, Tezos Price Analysis: 12 April

The crypto market saw a huge wave of selling over the past two days. Bitcoin fell by nearly 10% from $43.3k to $39.8k, and Solana and Tezos also posted similar losses. Solana has been in a near-term downtrend since the bearish retest of $136. EOS and Tezos also had a bearish outlook on the shorter timeframes. Yet, the day after a sharp drop sometimes presents buying opportunities.
Solana (SOL)
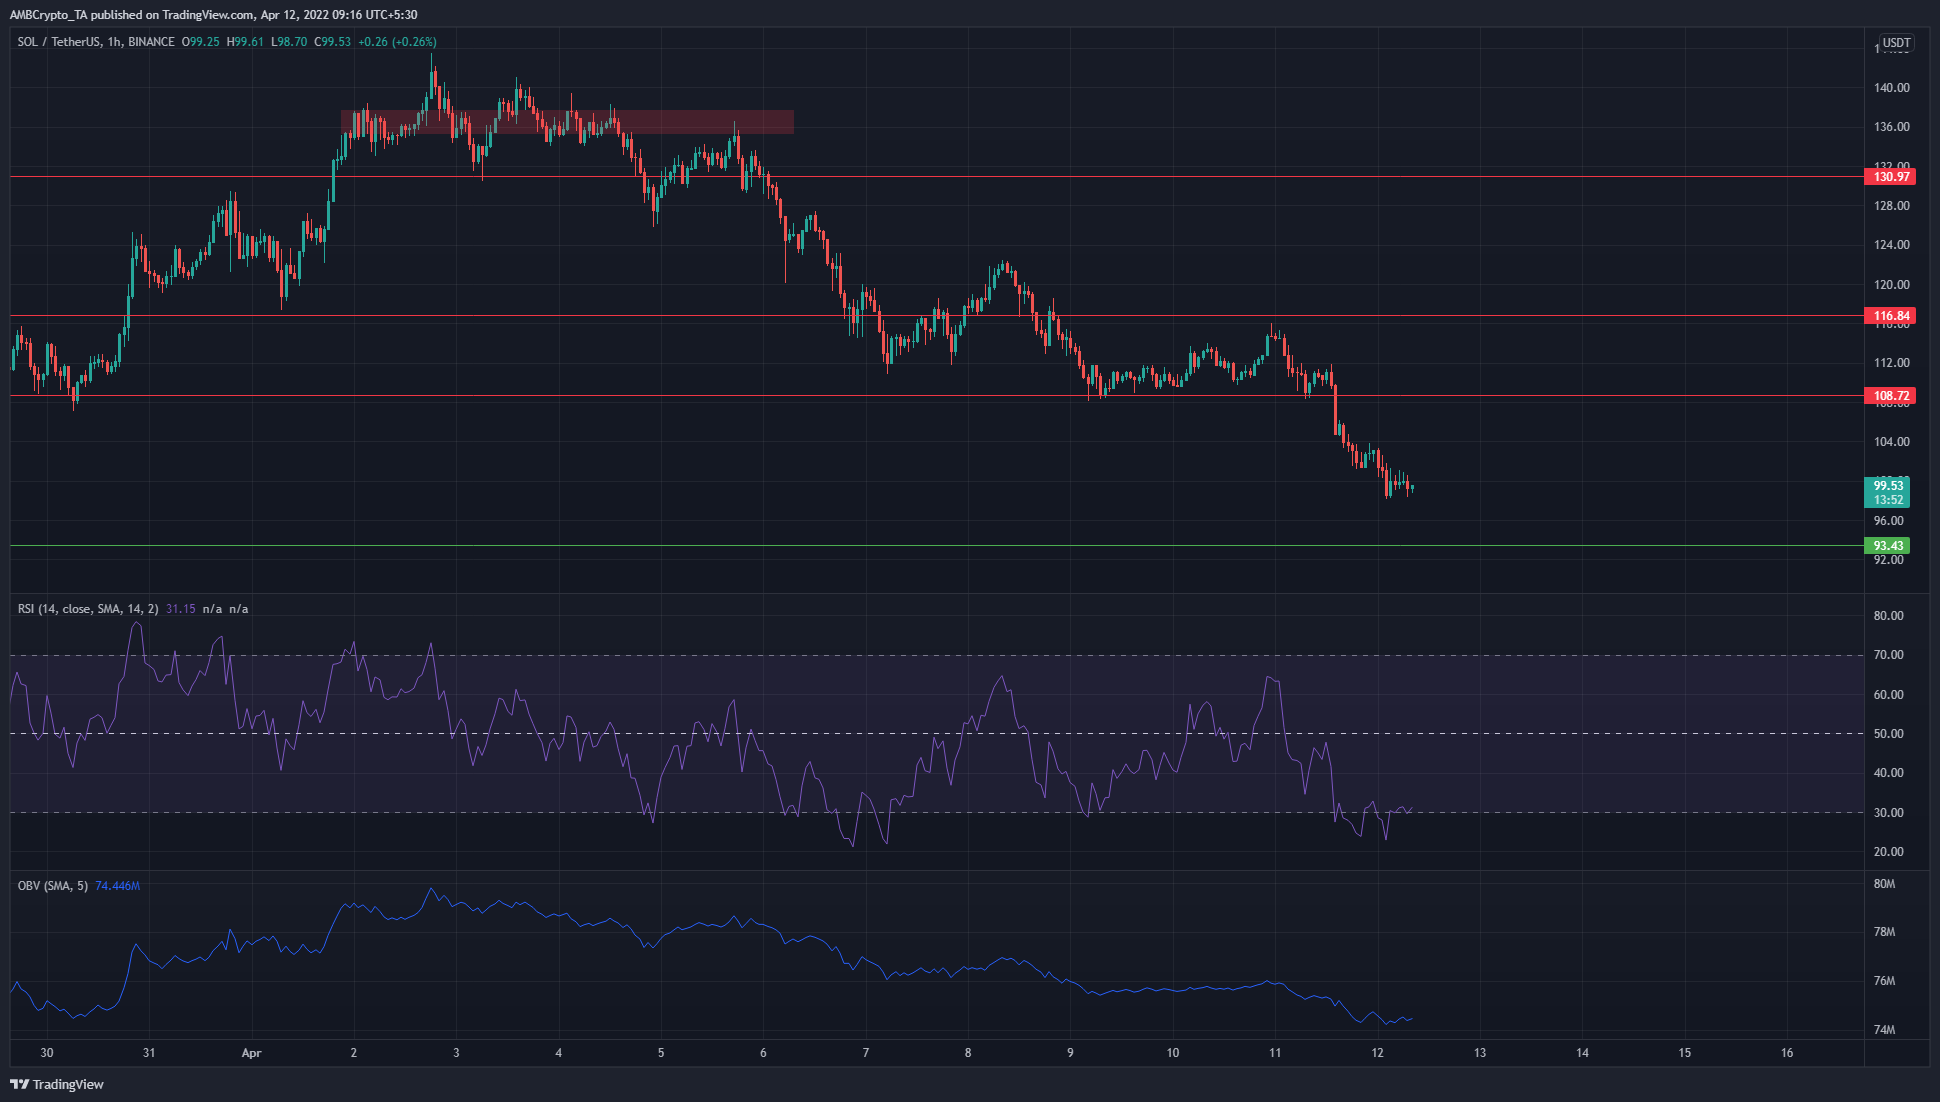
SOL has been in a downtrend over the past week and was trading at the $100 area at the time of writing. The $98-$100 area has acted as support in the past, and SOL could see a bounce from this area.
The RSI was at 31.15 and showed strong bearish momentum. The OBV has also been in a downtrend in the past ten days, to show that selling pressure has been much stronger than the buyers. A bounce toward $108 could occur. The $105-$108 area could see selling pressure intensify once more.
EOS
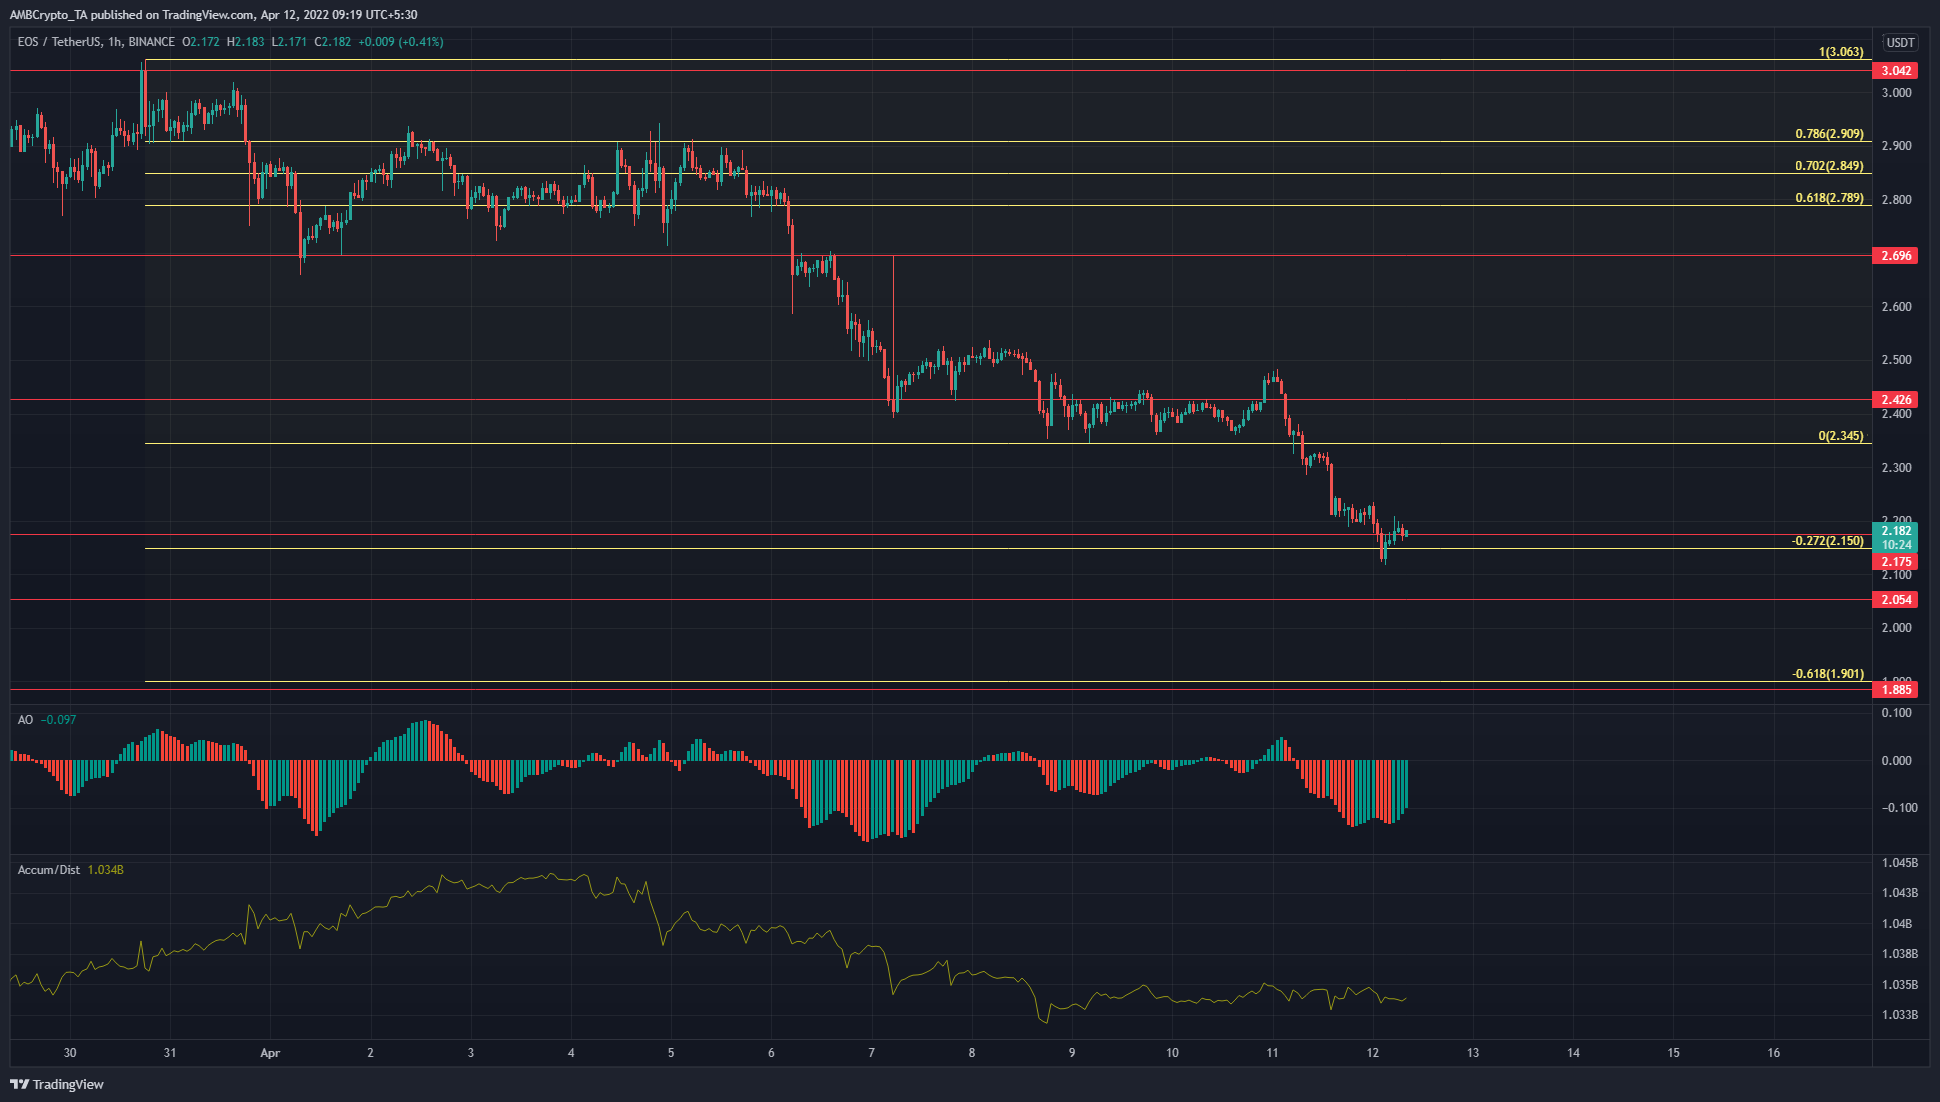
EOS has also displayed strong bearish momentum in recent days coupled with heavy selling volume in the market. The Awesome Oscillator was beneath the zero line, while the A/R line was moving sideways in the past couple of days. This could hint at a bounce toward $2.3.
The Fibonacci extension levels (yellow) plotted based on EOS’ move down from $2.34 to $3.06 showed the 27.2% and 61.8% extension levels to lie at $2.15 and $1.9.
Another session close beneath $2.15 would likely see EOS descend toward $1.9.
Tezos (XTZ)
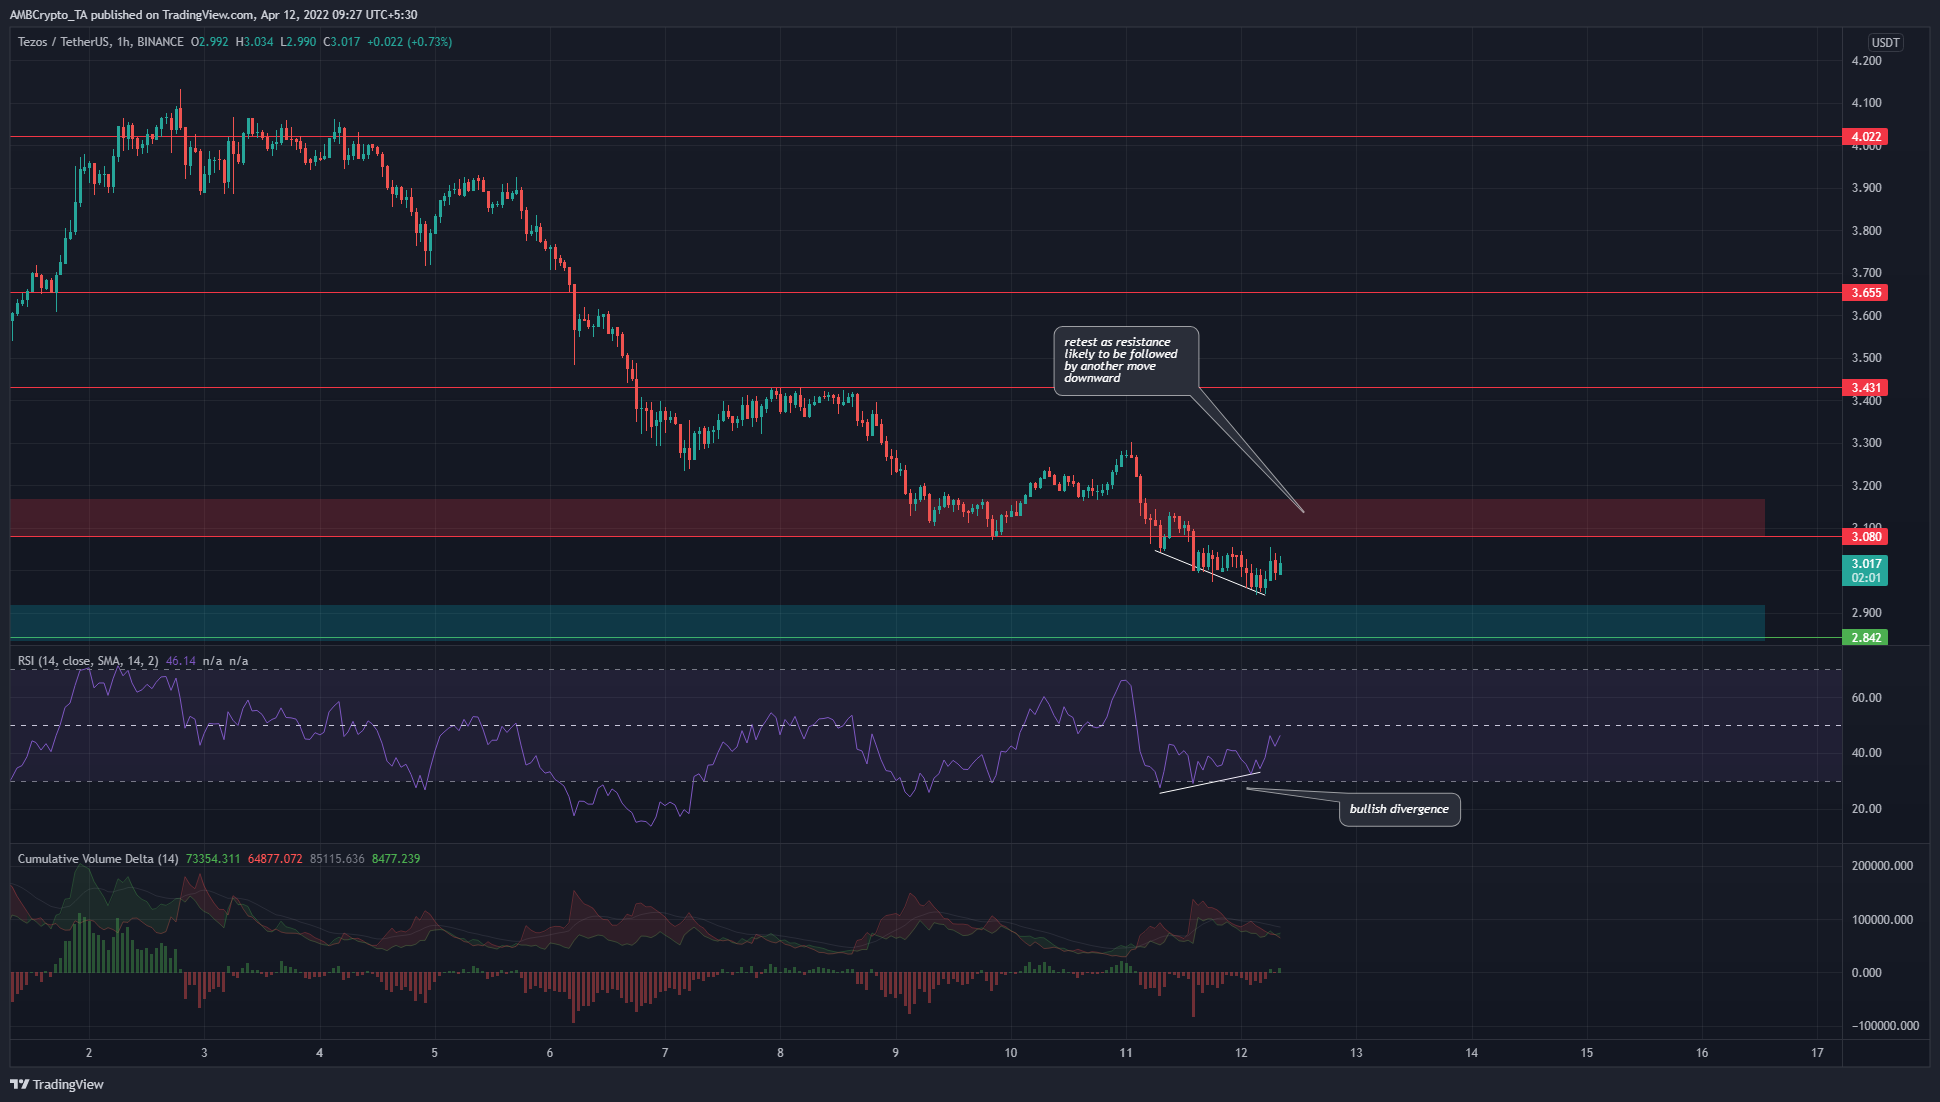
The RSI and the price movement on the hourly chart showed a bearish divergence. The CVD also climbed into positive territory to denote the buying pressure to be just barely stronger than the selling pressure.
The $3.1-$3.17 area (red box) could pose resistance to an XTZ bounce. To the south, the $2.84-$2.9 area could offer support. Hence these areas can be selling and buying opportunities in the next few days.