Solana in near-term could face selling pressure in this area

Disclaimer: The findings of the following analysis are the sole opinions of the writer and should not be considered investment advice.
Solana had crucial support at $37.71 but this level was broken in a swift move as Bitcoin plunged from $22k to $21k in the span of four hours.
At the time of writing, Solana had a strong bearish outlook and a retest of the $38 zone could offer a shorting opportunity. Sellers took the driving seat on 24 July and haven’t relinquished it yet, and the bleeding could continue through this week.
SOL- 2-Hour Chart
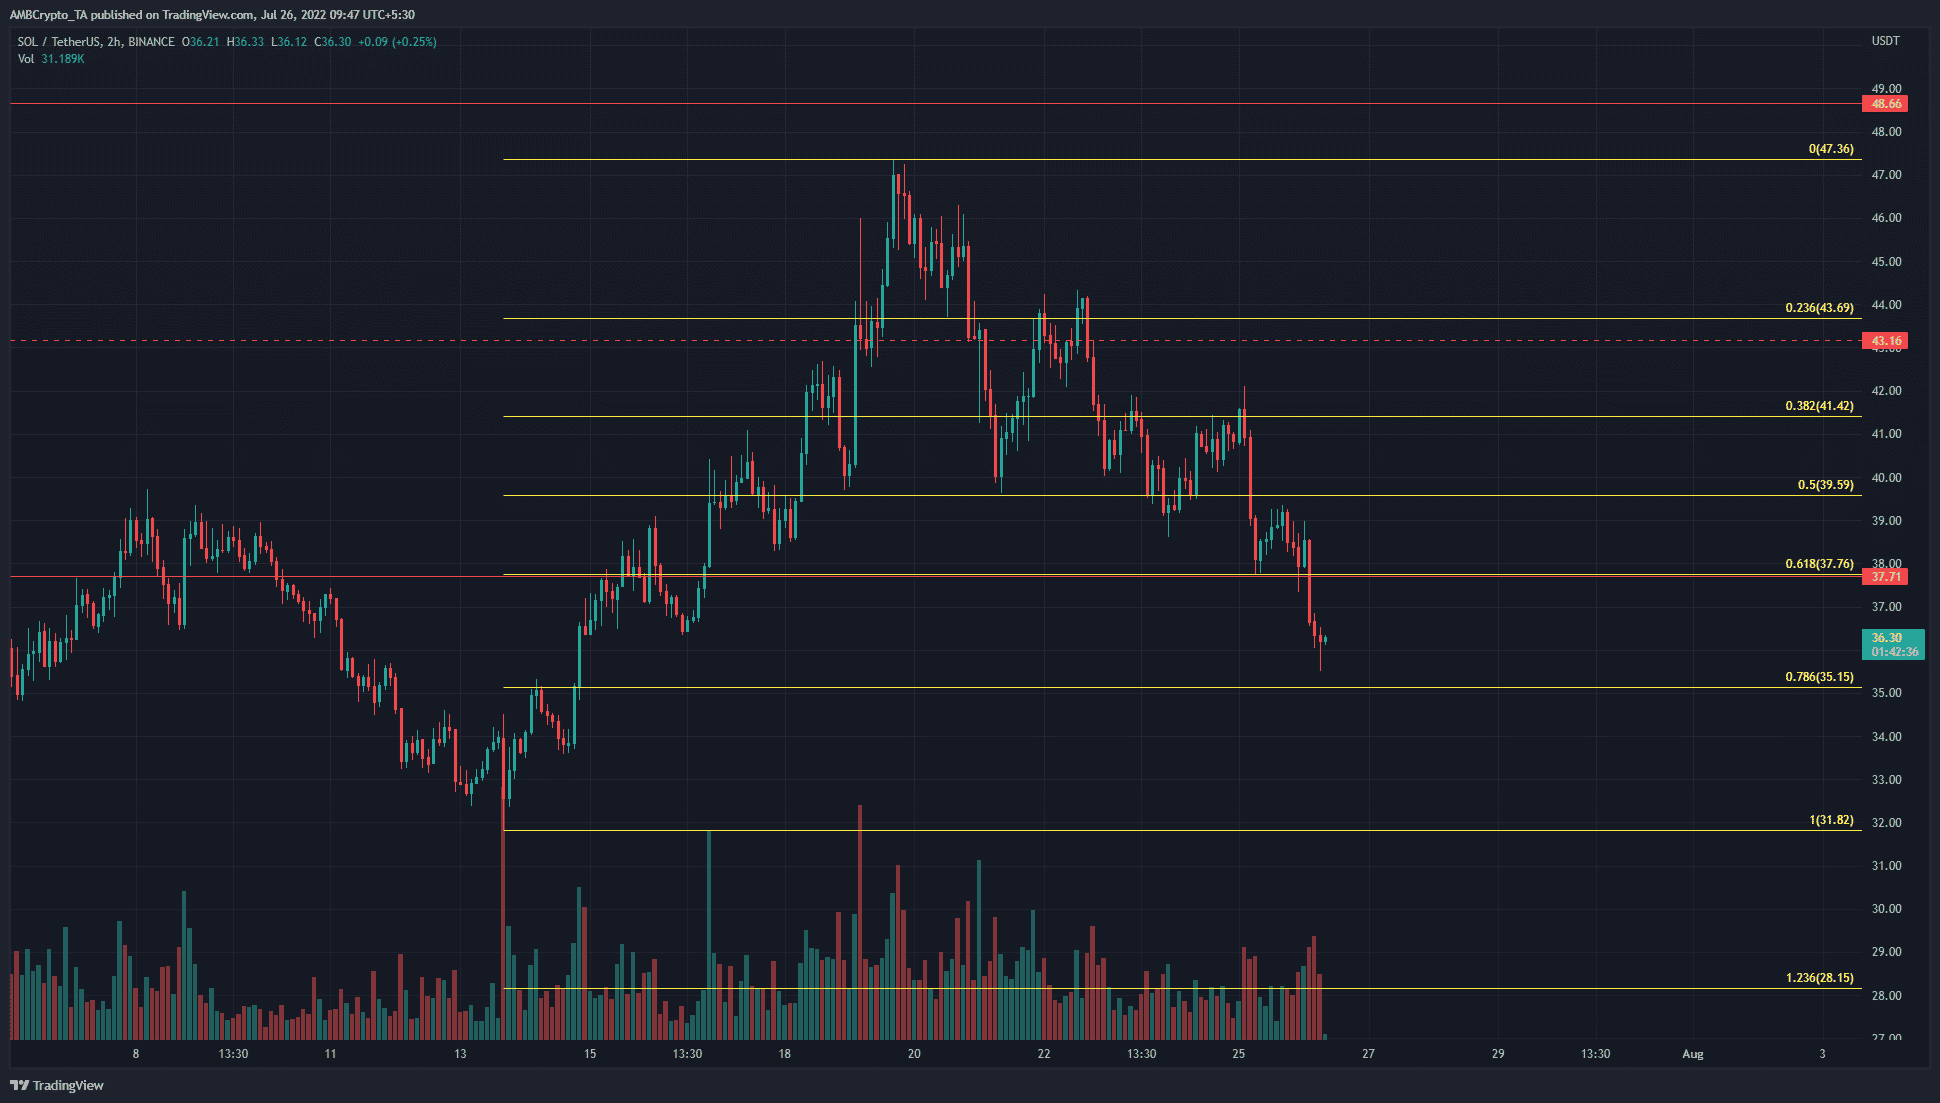
Based on the swing low and swing high at $31.82 and $47.36 respectively, Fibonacci retracement levels were plotted. The 61.8% retracement level had confluence with the horizontal level at $37.71, but SOL broke through this region with force.
The previously bullish structure was also broken last week when buyers were unable to defend the $43-$44 region.
Solana had a shorter timeframe bullish structure since the start of July. In mid-June, a rally from $26 to $42 was initiated. It was borne on the back of steady demand as well.
In July, the bulls were able to maintain SOL’s upward trajectory as they pushed the coin to retest the $38 region twice as resistance and flip it to support two weeks ago. Another leg upward to $47 materialized, but Bitcoin was rejected at the $24.1k mark.
Bitcoin faced resistance at $21.6k-$21.9k, and the $22.5k areas. A move upward appeared unlikely. Price action-wise, it was a similar story for Solana. SOL was likely to face intense selling pressure at the $37.7 mark as well as the $39.5-$40.5 area.
Rationale
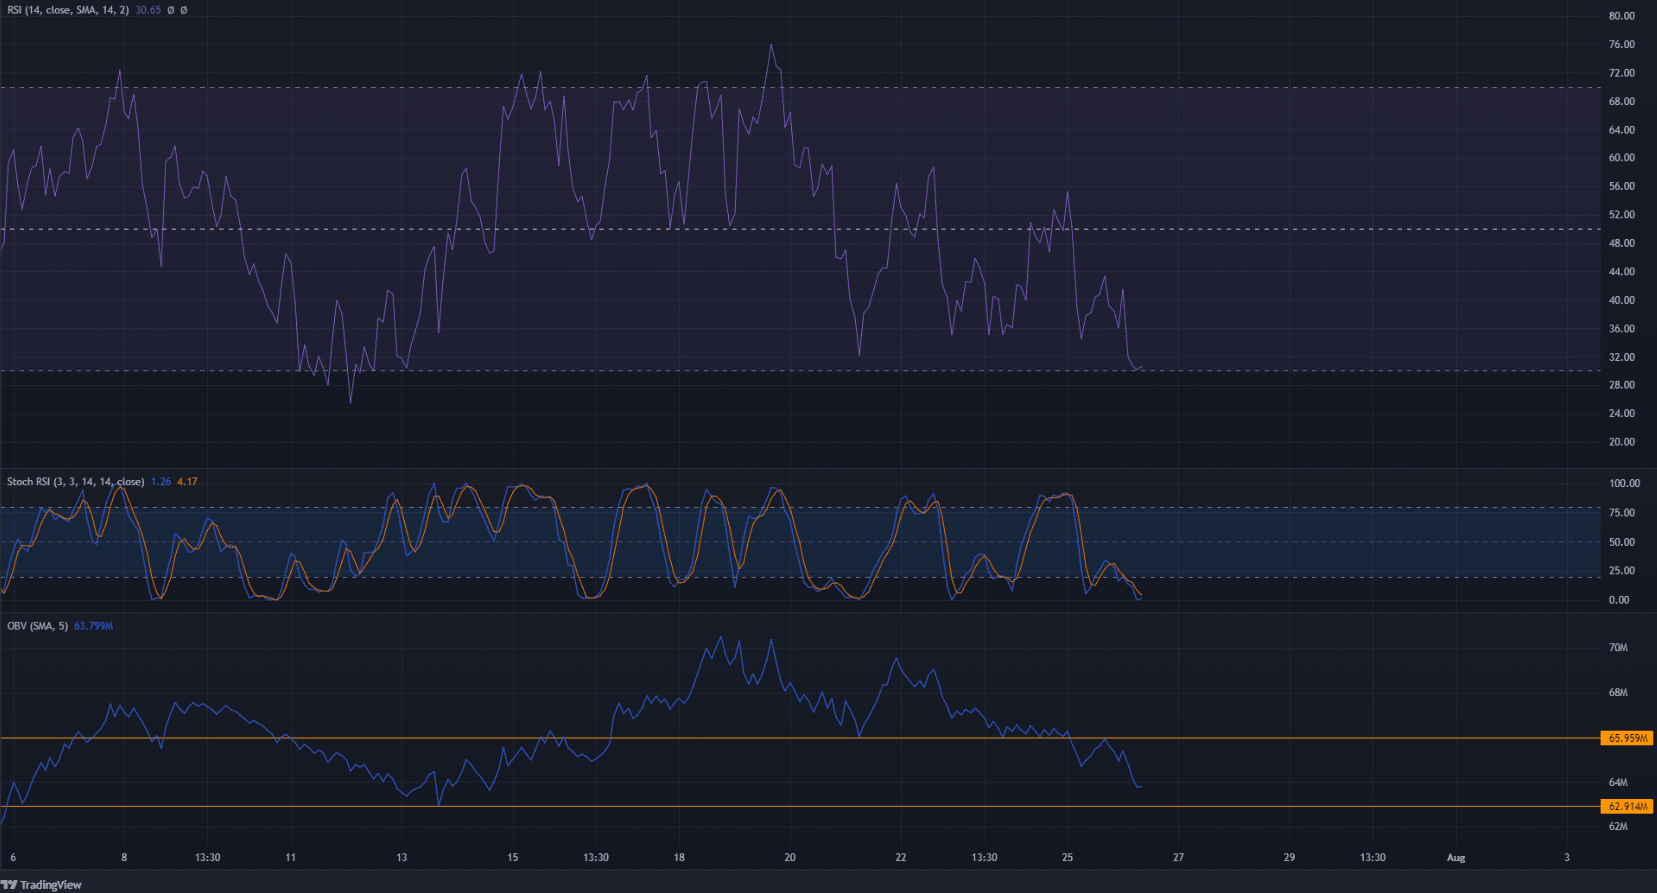
The 2-hour RSI dropped beneath the neutral 50 level a few days ago. In recent hours of trading, it dove below the 40 value as well, to signal strong bearish momentum.
The Stochastic RSI was at oversold territory. A bearish crossover in the overbought territory a few hours later can be a cue for the next move downward.
The OBV slipped beneath a support level from mid-July. Once again this highlighted the heavy selling pressure behind SOL. Volume favored the bears, and buyers looked unwilling to bid yet.
Conclusion
Strong bearish momentum was apparent for Solana, and the next levels of support to watch out for are $35.15 and $32. A bounce to retest the $38 area as resistance could occur, but such a move should be seen as an opportunity to sell the asset.


