Solana, Litecoin, Cosmos Price Analysis: 07 November

At press time, most of the alts were trading in green in the last 24 hours. Altcoins like Solana, Litecoin, and Cosmos saw daily gains while their near-term technical indicators flashed mixed signals. After following a month-long bullish trajectory, Solana struck its ATH and showed signs of easing bullish momentum.
Whereas alts like Litecoin and Cosmos showed signs of revival as their technicals pointed at easing bearish momentum.
Solana (SOL)
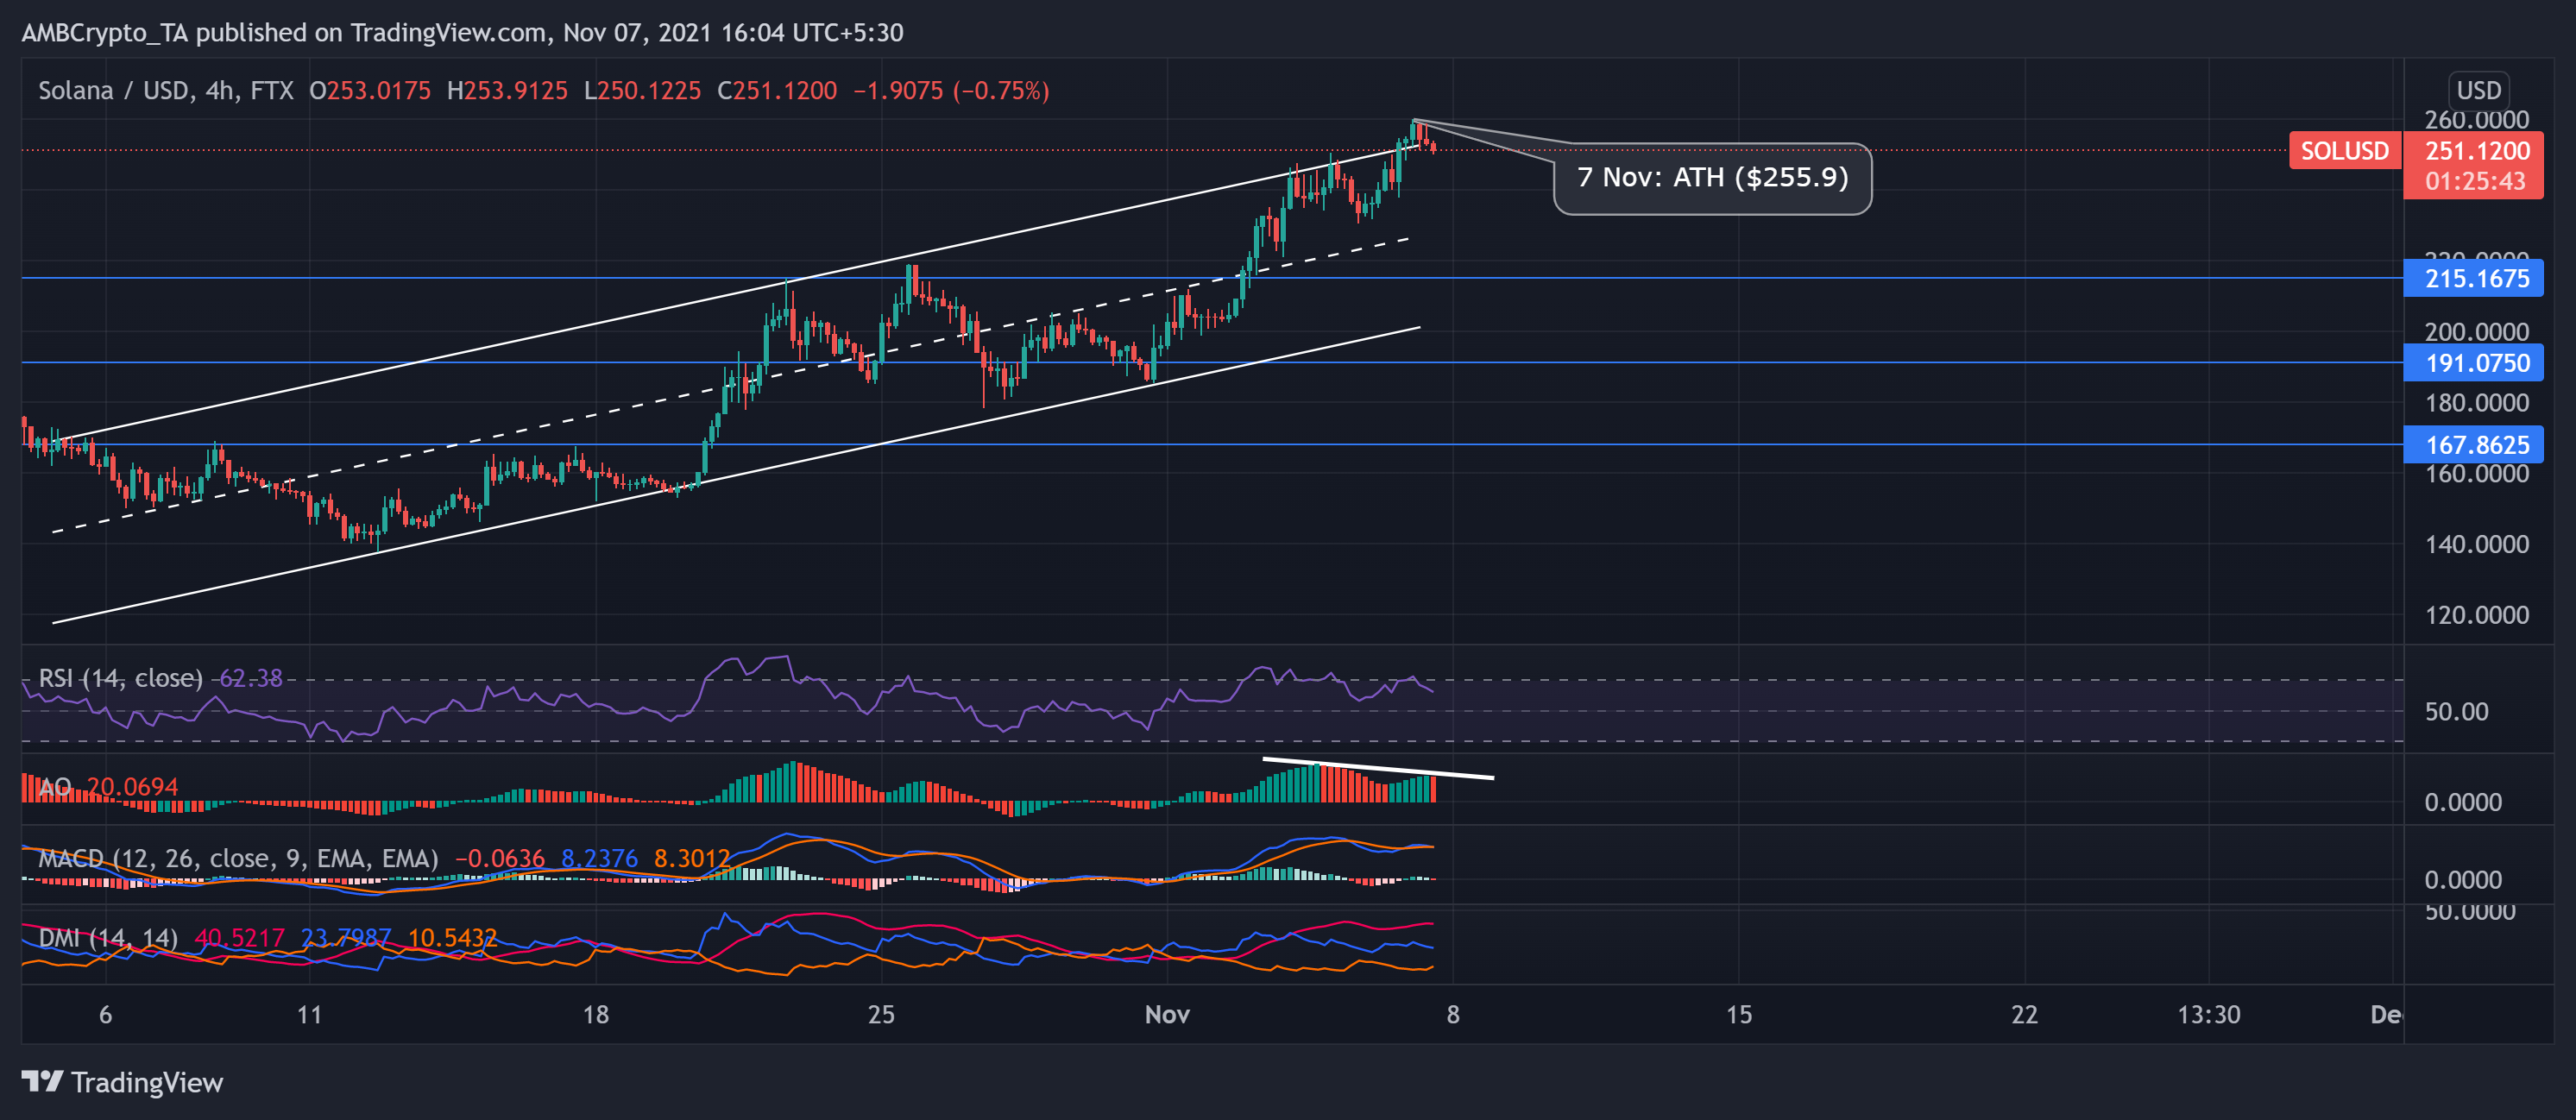
Since 6 October, the SOL price action was northbound after undertaking a bullish trajectory and oscillated between the parallel lines. The ‘smart contract platform’ registered a staggering 64.4% and 31.2% monthly and weekly ROI, respectively.
Consequently, the price marked higher highs and ruptured the upper trendline to strike its ATH at $255.9950. After this, it witnessed a slight pullback as the near-term indications pointed at easing bullish influence. If the bears can demonstrate sustained pressure, the price may see a correction by falling back into the trend. At press time, SOL traded at $251.12.
The RSI dipped from the overbought region to the 62-mark. This plunge notably depicted easing bullish momentum. Additionally, MACD and the AO histograms displayed red signals and reaffirmed the decreasing buying power. Moreover, DMI lines continued to prefer the buyers, but their directional tendencies reiterated the decreasing bullish strength.
Litecoin (LTC)

Since the beginning of October, LTC bulls displayed their vigor as the price rallied by nearly 29% to hit its five-week high on 21 October. After which, the price-action witnessed a blip as it fell to its two-week low at $171.1. Since then, the bulls were again keen on sustaining pressure as the price registered an 8.31% gain over the past ten days. On the other hand, LTC bears have shown resistance at the $203-mark.
The near-term technical indicators obliged the above observations by flashing a preference for increased buying strength. At press time, the altcoin traded at $198.5.
The RSI saw a surge in the last 24 hours, depicting an increasing buying strength. Additionally, the AO and MACD readings affirmed the previous analysis. However, the ADX stood at the 10-mark, indicating a profoundly weak directional trend.
Cosmos (ATOM)
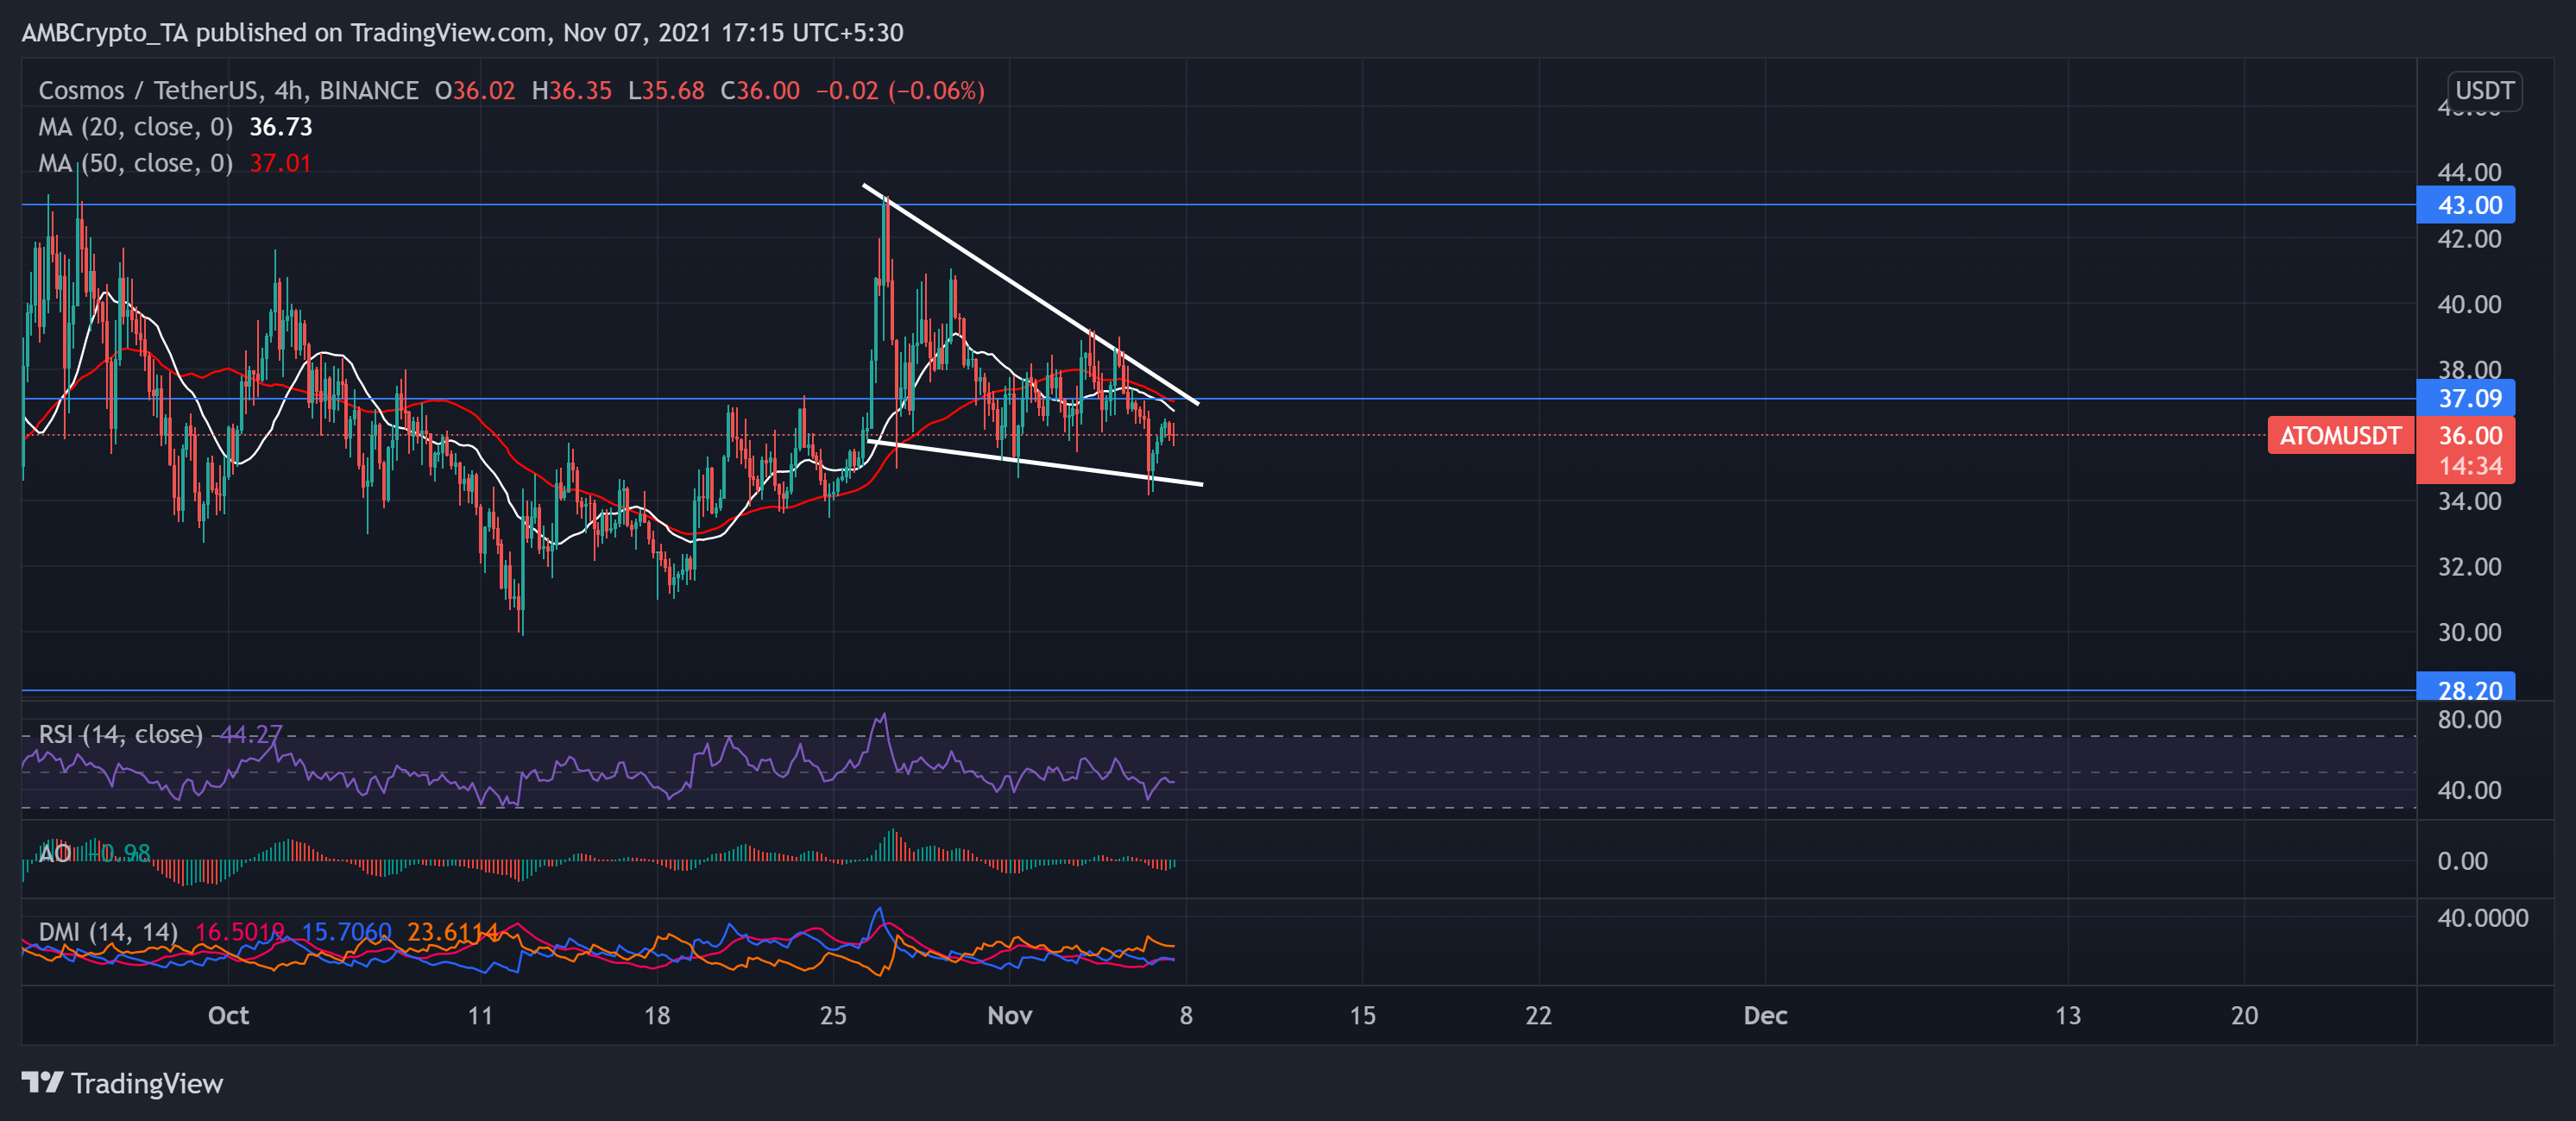
After hitting its one-month high on 27 October, ATOM witnessed a pullback and registered a 2.7% loss on its weekly charts. The bears gathered momentum, as confirmed by the 4-hour 20-50 SMA. As a result, the price touched its two-week low on 6 November at the $34-mark. Since then, ATOM bulls have shown signs of revival as the near-term readings hint at decreasing selling strength.
The altcoin traded at $36.00 after noting a 1.52% gain in the last 24 hours.
The RSI surged by 10 points over the last day as it headed towards the midline. Furthermore, the AO flashed green signals as it approached the zero line. However, the DMI lines showed a continued preference for the sellers with significantly weak directional trends.