Solana, Loopring, ApeCoin Price Analysis: 24 March

Solana broke above the $90 level and showed some near-term bullish strength as it headed into a bearish order block in the $95 region. Loopring saw enormous demand the previous day, and the large buying volume drove the price to test a significant resistance level at $1.23. ApeCoin has a bullish market structure as well.
Solana (SOL)
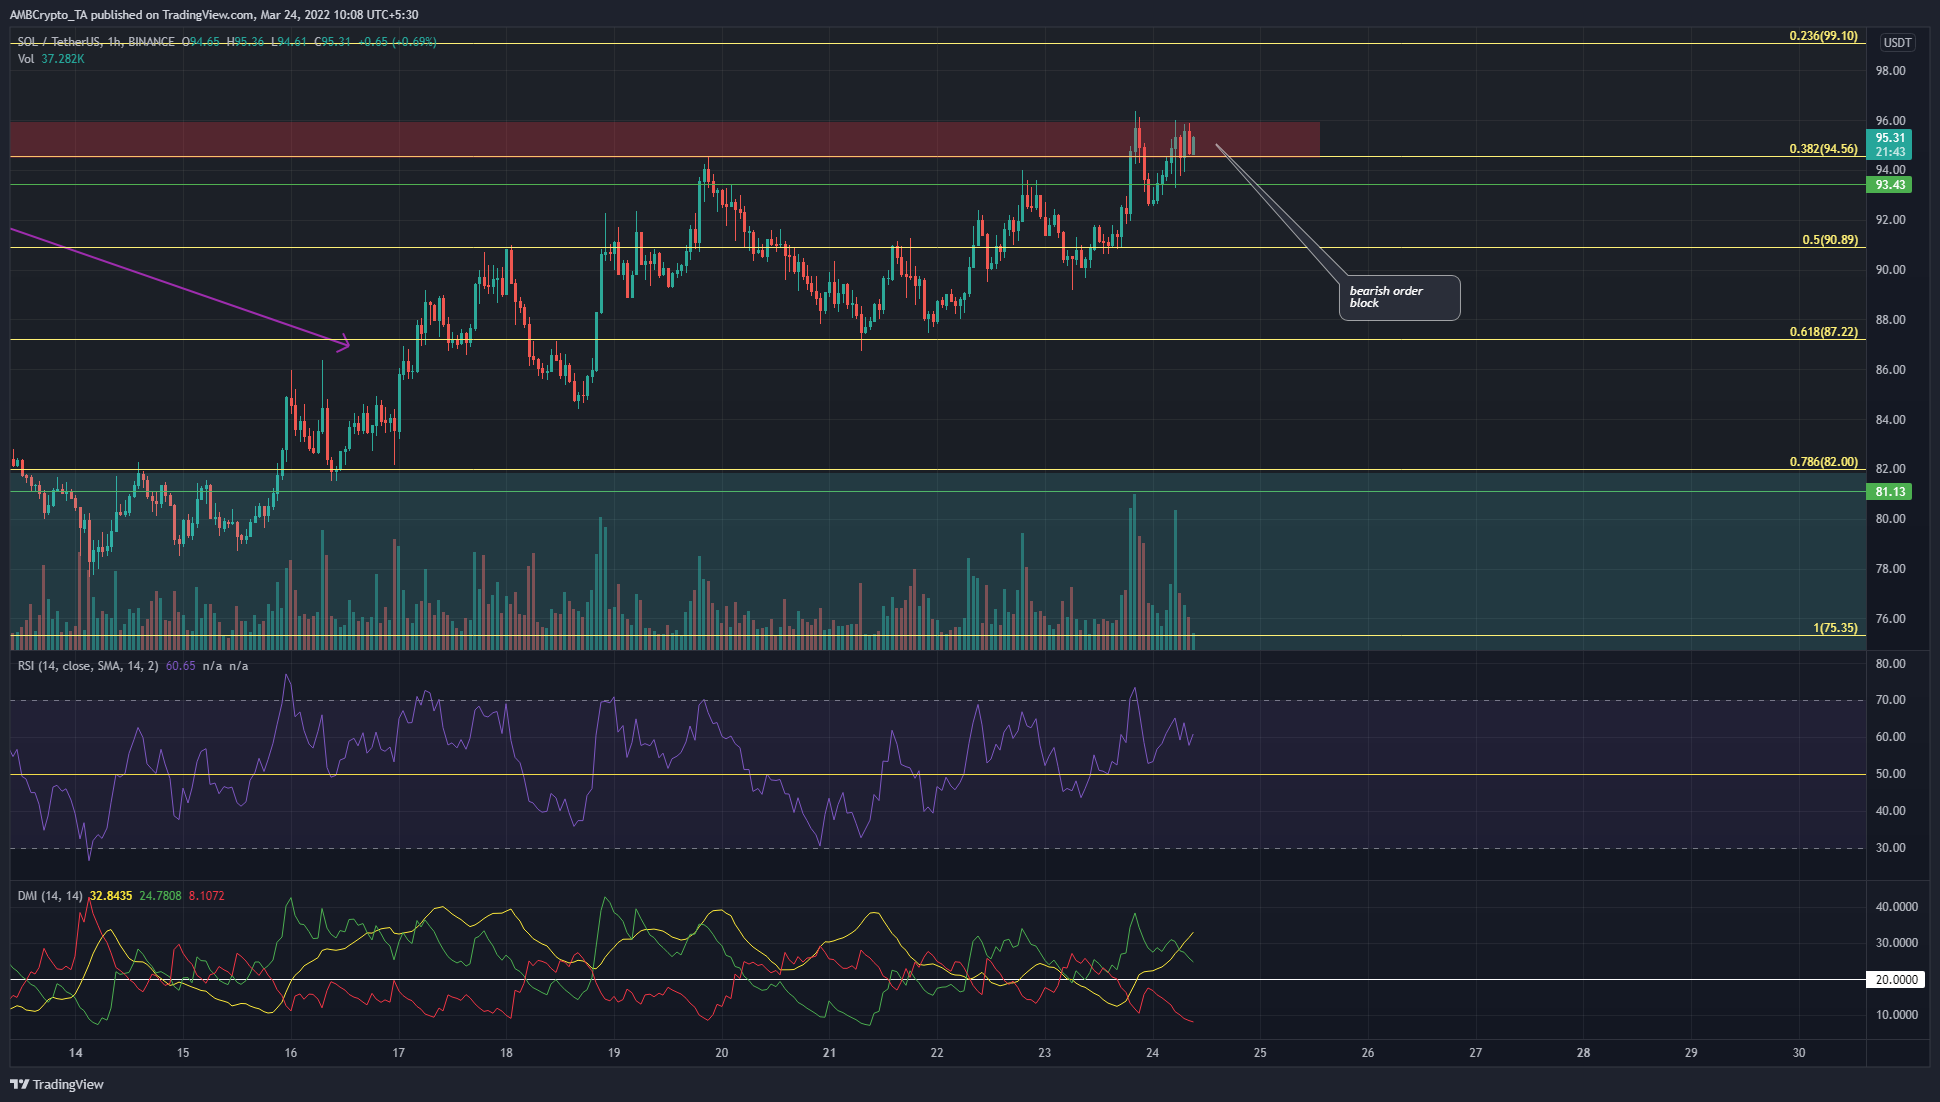
In late February and early March, the $94.5-$96 area (red box) had seen a bearish order block established. At the time of writing, the price had once more pushed into this region. Whether SOL can push higher or will see a rejection, a pullback and another attempt to scale these local highs remain to be seen.
The RSI stood at 59.85 and a bearish divergence between price and momentum wasn’t present on the hourly chart, although a possible divergence was developing on the 4-hour chart. This could see SOL retrace toward $88-$90. The DMI showed a strong uptrend in progress, hence any pullback could be a buying opportunity at the Fibonacci retracement levels (yellow).
Loopring (LRC)
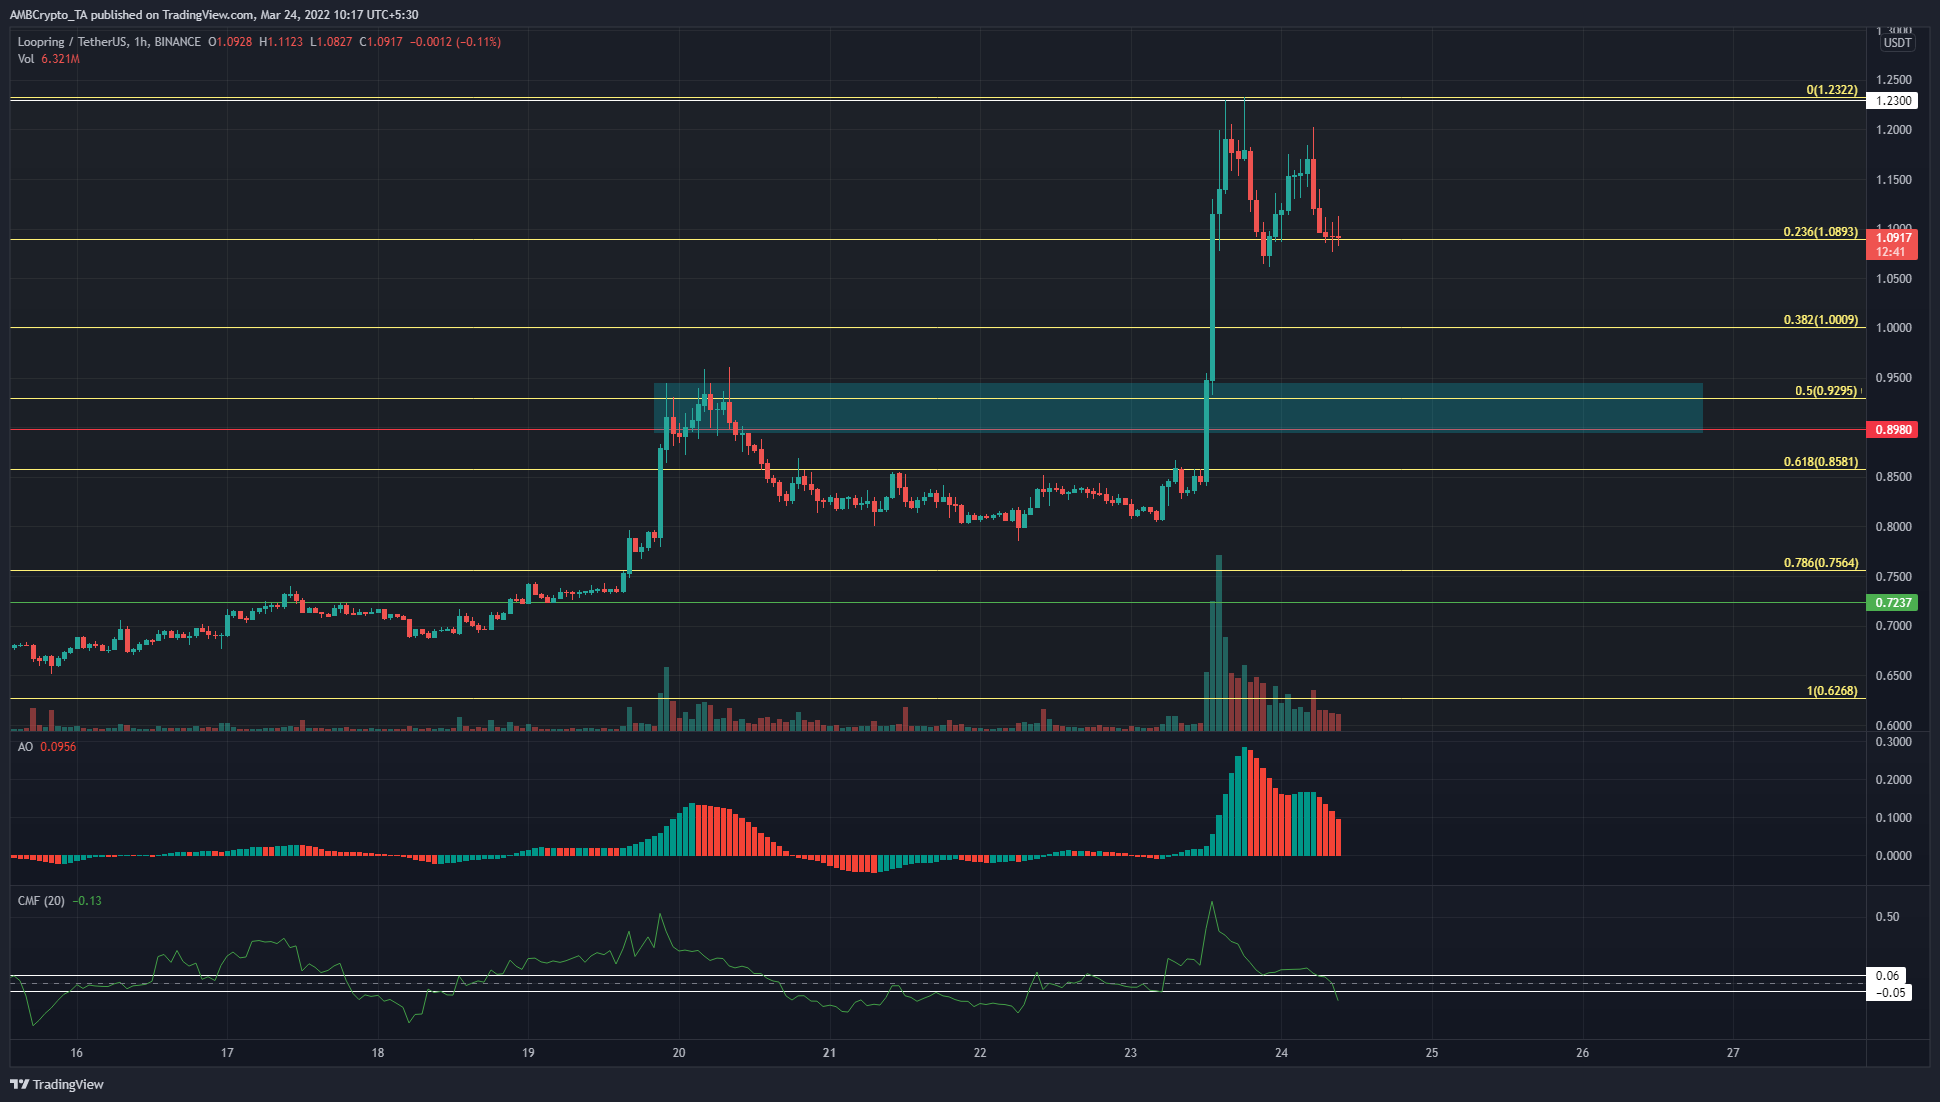
The previous day saw LRC rejected at the $1.23 level. On a higher timeframe, the $1.23 level had been the prevailing downtrend’s latest lower high. Hence, this pump to the $1.23 level can be seen as an attempt to break the longer-term market structure- an attempt that has not yet succeeded.
To the south, the $0.92 area (cyan box) could serve as a demand zone. It also has confluence from a set of Fibonacci retracement levels (yellow). The Awesome Oscillator was above the zero line but inching lower, while the CMF fell below -0.05. Hence, a move toward the $0.92 area looked likely.
However, the heavy buying volume on the recent pump indicated bulls could make yet another attempt to breach resistance.
ApeCoin (APE)
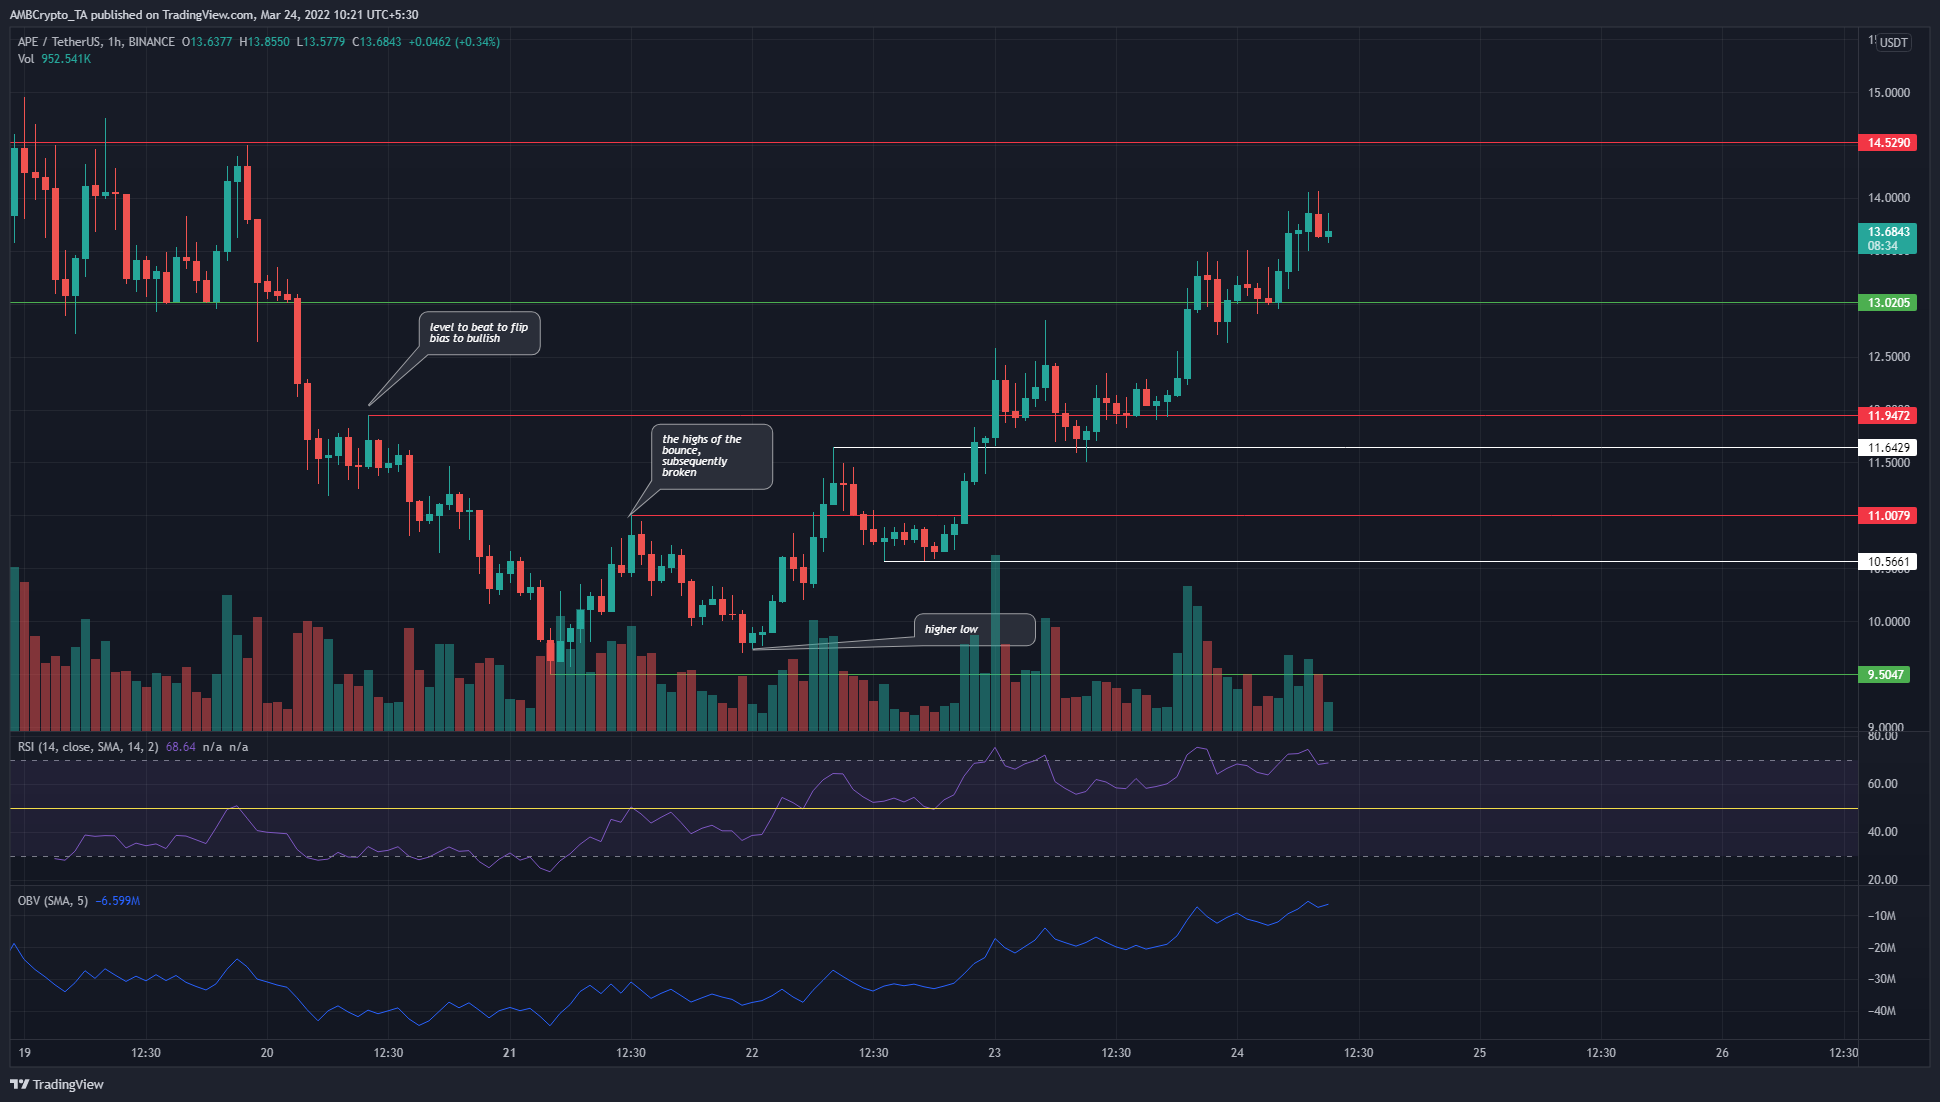
As highlighted on the chart, APE has been showing bullish signs in the past couple of days. The $11 and $11.94 levels of near-term resistance were broken and flipped to demand zones, and the $13 level has also been flipped to support in recent hours.
The RSI continued to show strong bullish momentum, although a bearish divergence could develop as the price pushes higher. The OBV showed healthy buying volume.


