Solana, LUNA, Tron Price Analysis: 10 March

While the last 24 hours proved to be rather menacing for the bulls, the Crypto fear and greed index showed minor improvements in the overall sentiment. The near-term technicals of Solana, LUNA, and Tron exhibited a bearish inclination but the CMF kept the bullish revival chances bright in the days to come.
Solana (SOL)
SOL saw a nearly 47% loss (from 20 January) and touched its six-month low on 24 February. Since then, it saw an over 40% jump toward its $102-resistance.
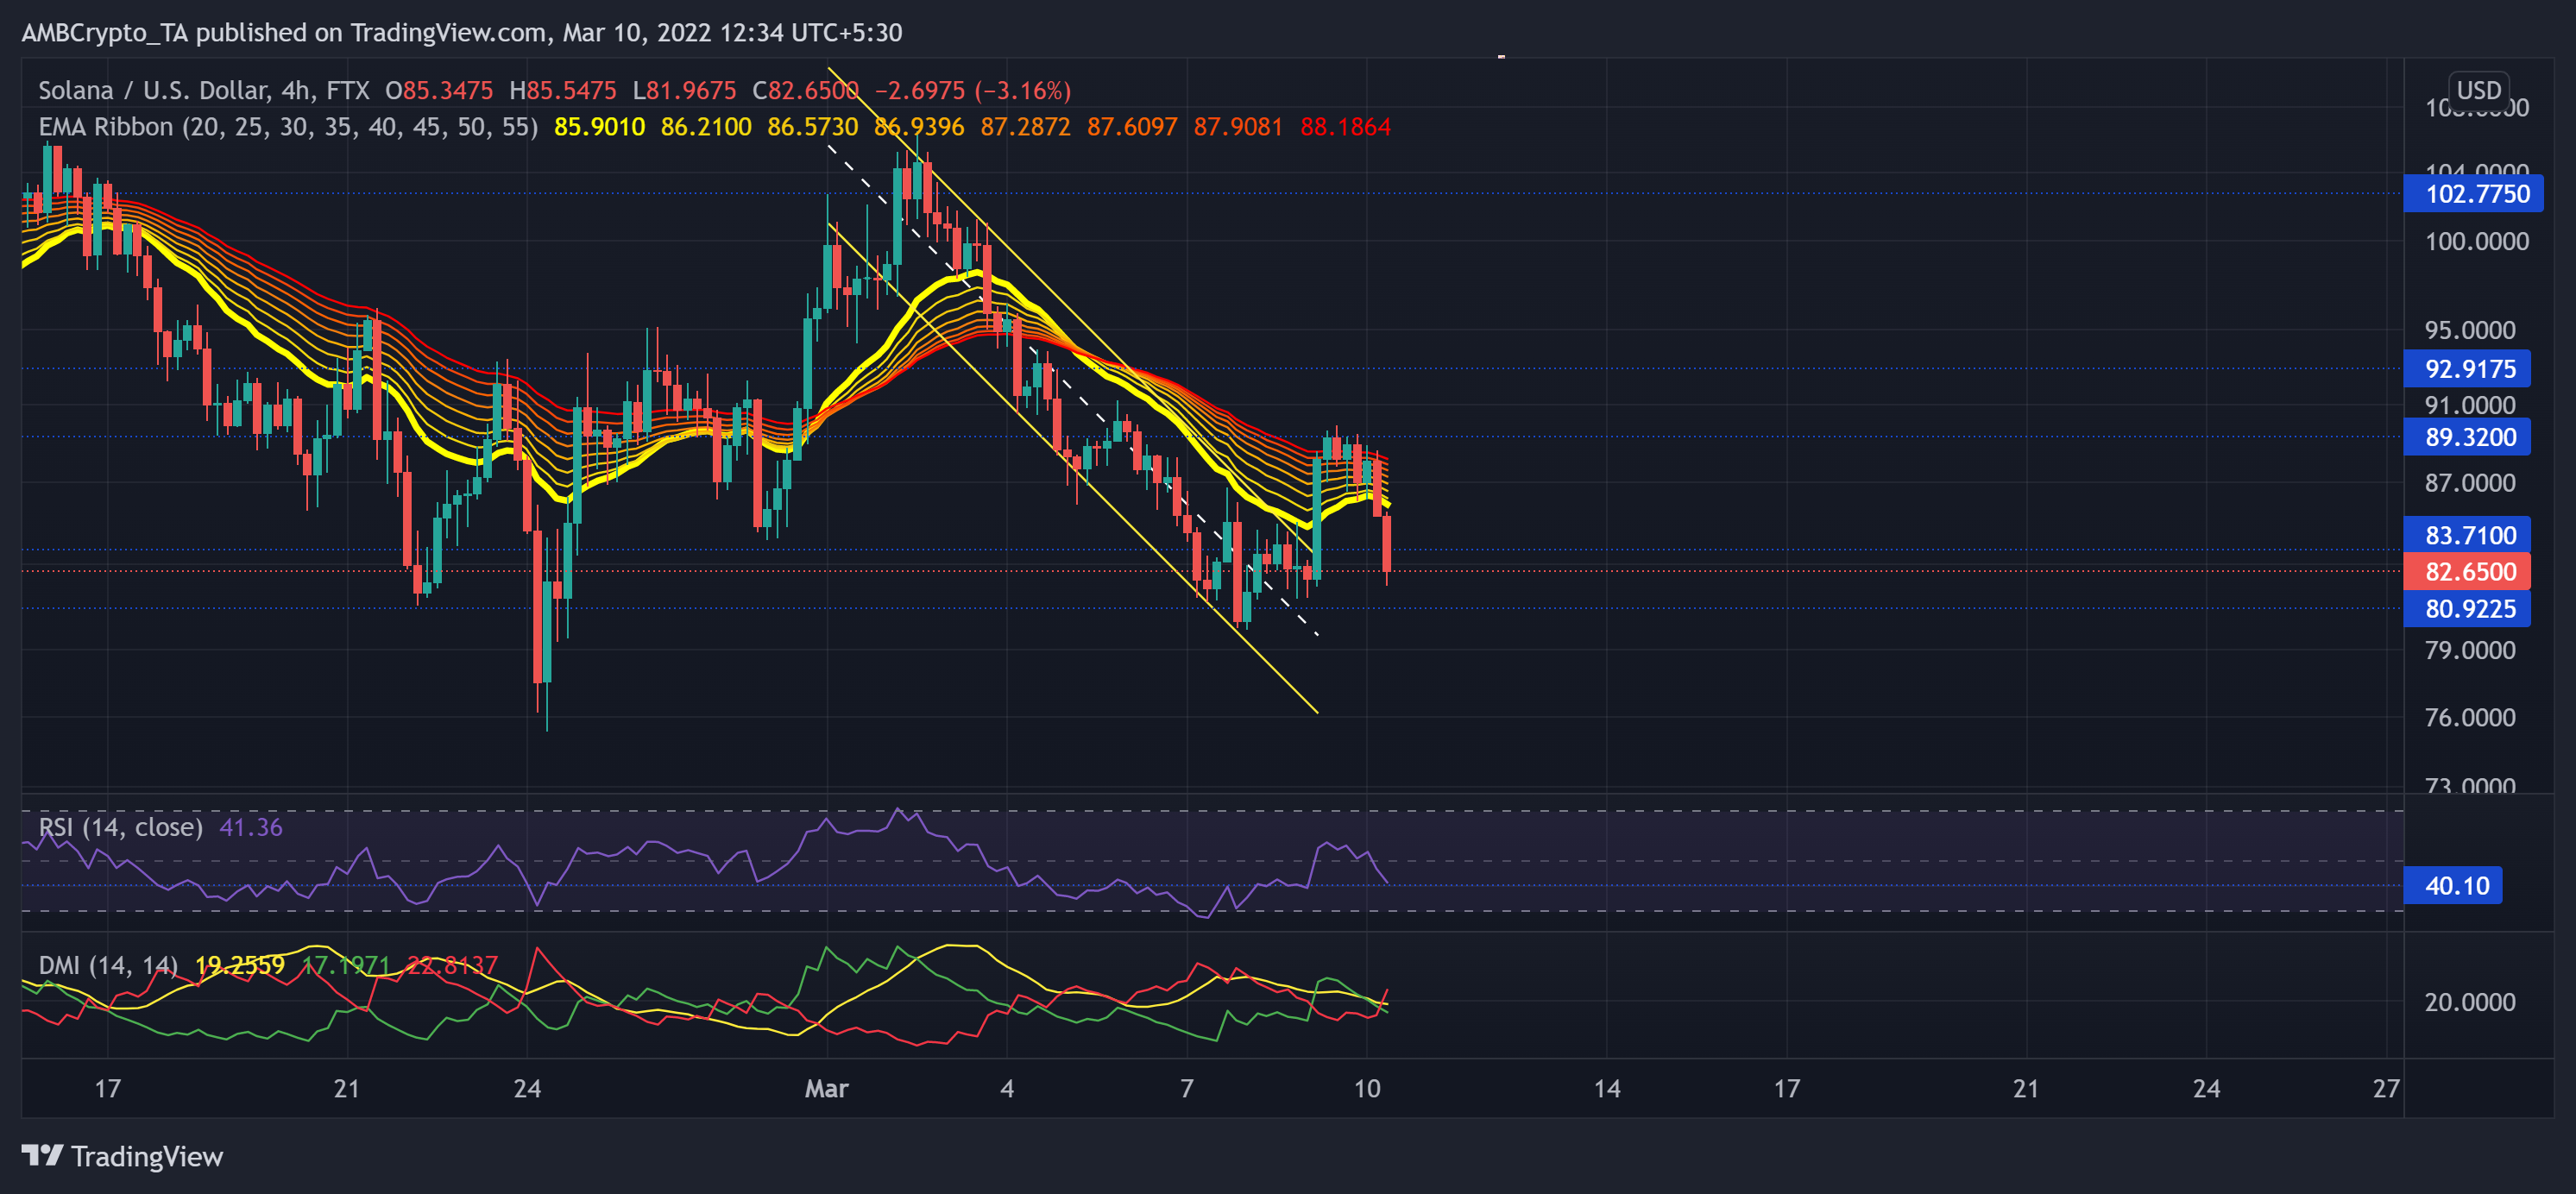
As the bears were keen on sustaining their edge, SOL quickly fell to test the $80-floor, while the EMA ribbons undertook a bearish flip. Despite the recent breakout from its down-channel, the alt struggled to find a close above the ribbons. Any further retracements should find testing grounds near the $80-mark.
At press time, SOL traded at $82.65. After losing its midline support, the bearish RSI aimed to test the 40-support. Also, while the -DI (of the DMI) looked north, it affirmed the near-term bearish movements for the alt. But the ADX continued to stand weak and project a fragile directional trend.
Terra (LUNA)
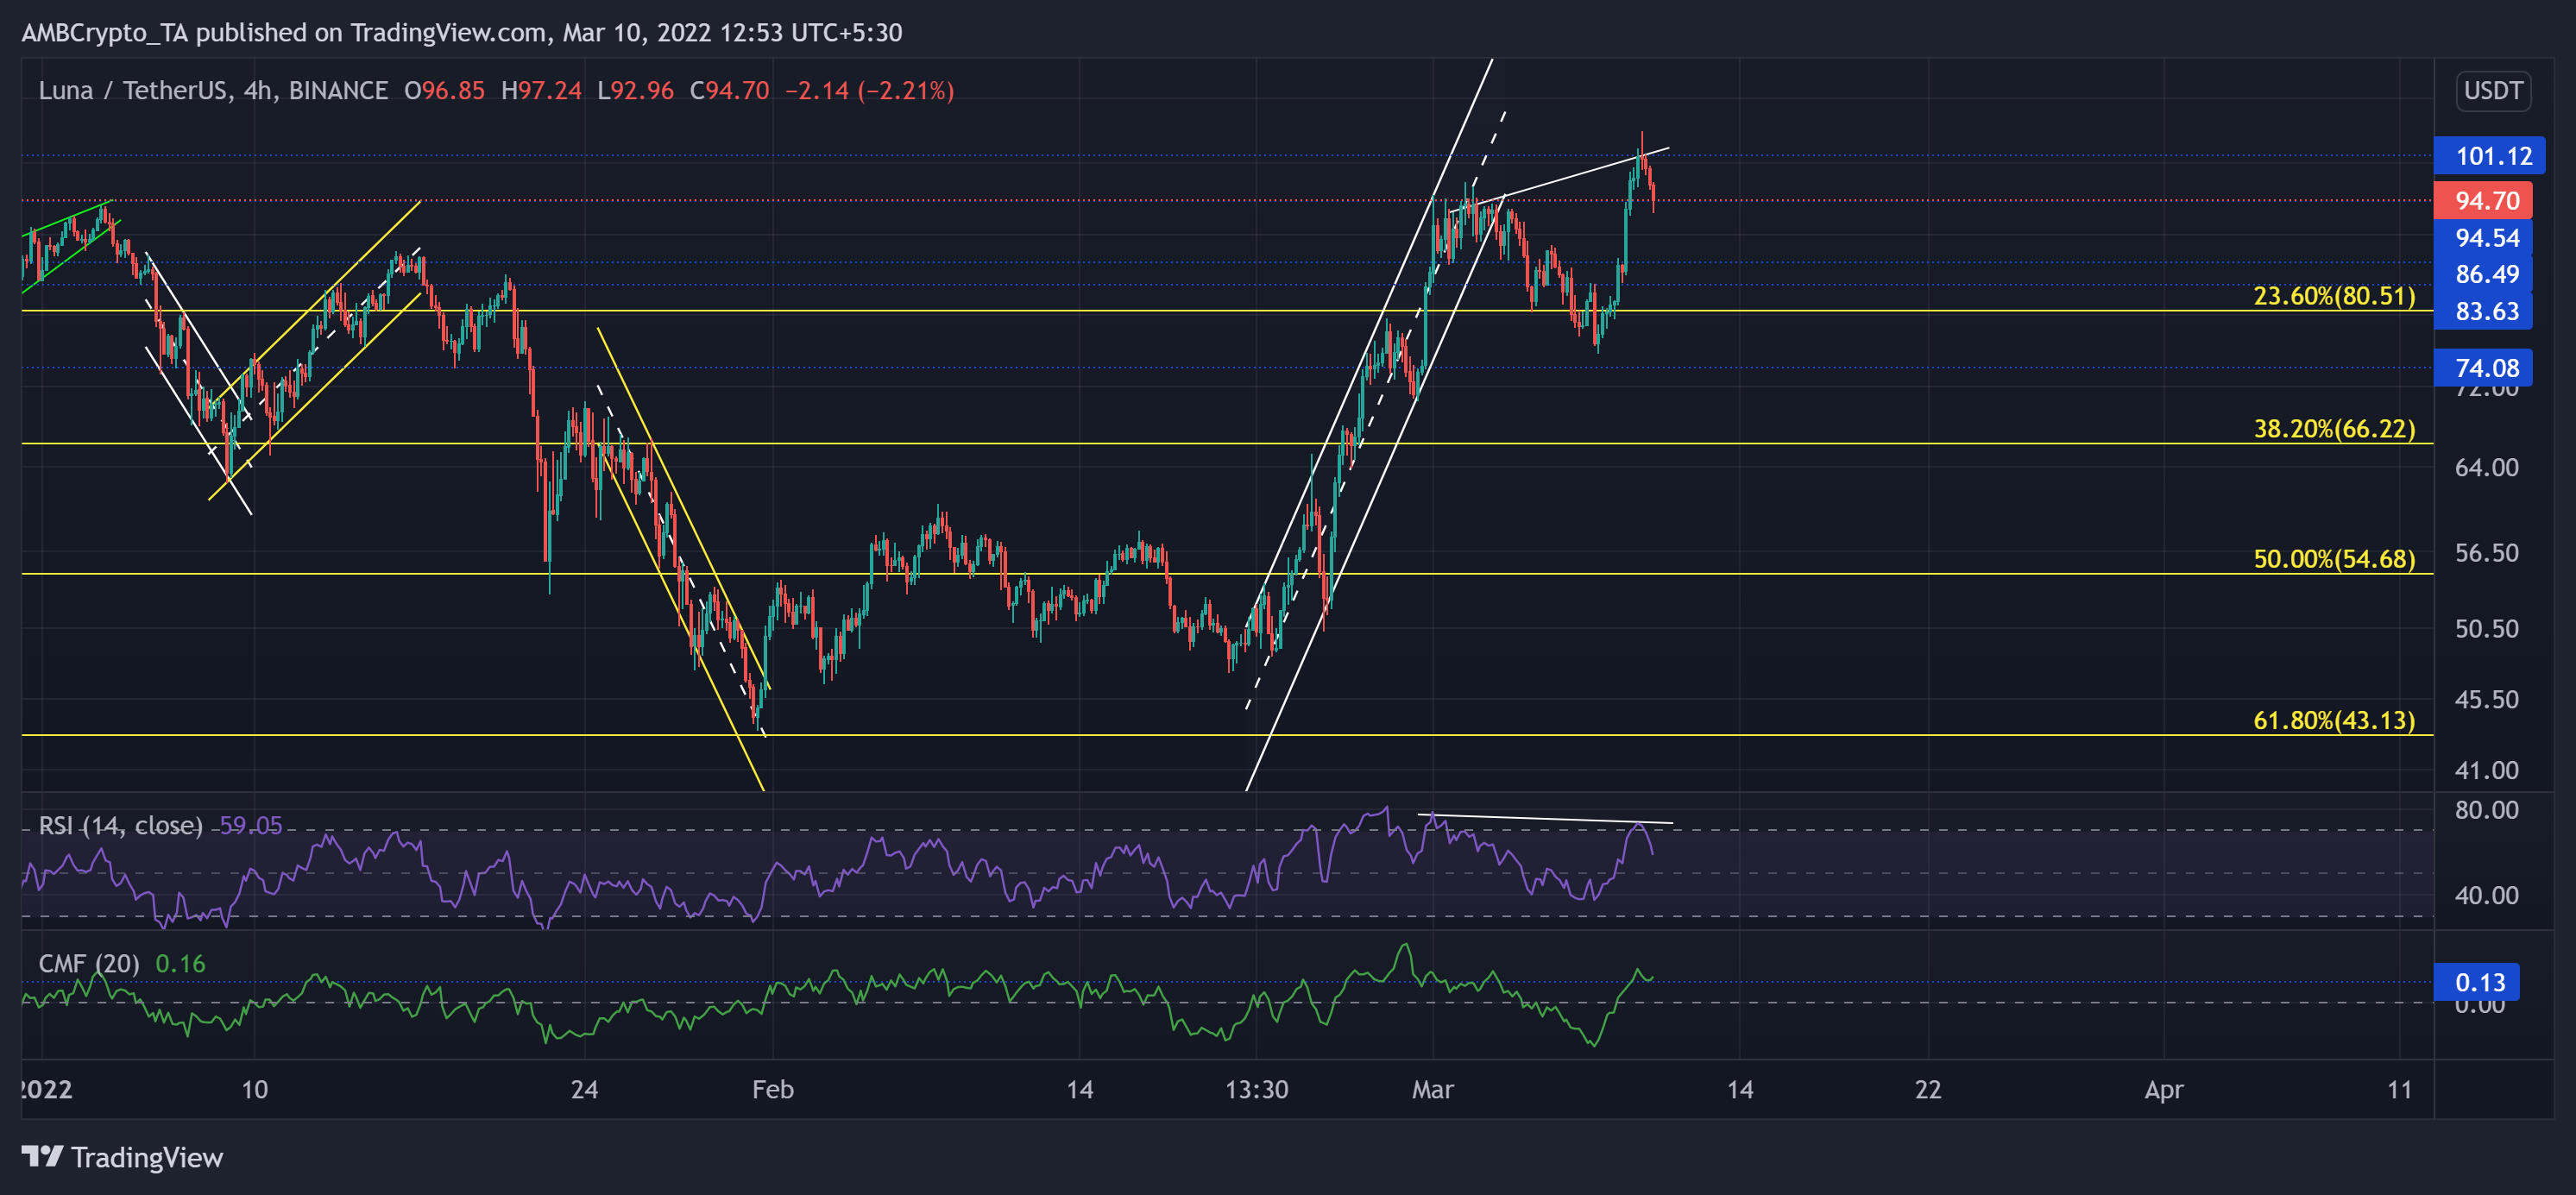
After breaking down from the up-channel from the $86-mark, LUNA lost half its value and plunged towards its two-month low on 31 January. This level coincided with the 61.8% Fibonacci support. Consequently, the alt entered into a recovery phase.
It doubled its value in the course of the next few days before facing a barrier at the $101-mark. A strong pullback from here would continue to find testing support at the 23.6% Fibonacci level.
At press time, LUNA was trading at $94.7. The RSI hovered above the midline but depicted a decreasing buying influence. After a bearish divergence (white trendline), it showed slowing signs and reversed from the overbought mark. Nevertheless, the CMF continually revealed a bullish edge after ensuring its 0.13 support.
Tron (TRX)

While recovering from its six-month low on 24 January, TRX grew in an ascending channel (yellow) on its 4-hour chart.
It registered nearly 40% gains to retest the 61.8% Fibonacci resistance on 10 February. Since testing this level, the altcoin steeply downturned while the 23.6% level offered support. From here on, any bullish comeback could find resistance at the $0.06-level.
At press time, TRX traded at $0.05854. The bearish RSI failed to uphold its trendline support as the bears took over. Now, the 33-36 range would be vital for the buyers to step in and trigger a pullback. Although the MACD reaffirmed the bearish vigor by falling below the zero line, the CMF kept the bullish revival hopes alive.