Solana, MATIC, Tron Price Analysis: 07 February

While the overall market sentiment improved, Solana, MATIC and Tron continued their up-channel oscillation. As a result, they reclaimed lost support levels. Their near-term technicals displayed a bullish bias but the overbought readings on their 4-hour chart could cause a potential slowdown.
Solana (SOL)

SOL noted a 52.2% loss (from 5 January) and touched its five-month low on 24 January. Since then, it saw an over 47.2% jump while forming an up-channel on its 4-hour chart.
The rally then reversed from the upper band of the Bollinger bands (BB). During this phase, it reclaimed the vital $102-mark support. Further retracements from here would again find a testing floor near the midline of the up-channel.
At press time, SOL was trading at $117.25. The RSI tested the overbought region multiple times over the past week. Thus, revealing a one-sided bullish influence. Nevertheless, any close below the 63-mark could propel a retest of the 56-point RSI support. Also, the Volume oscillator was on a downtrend, hinting at inadequate thrust to sustain a further breakout.
Polygon (MATIC)
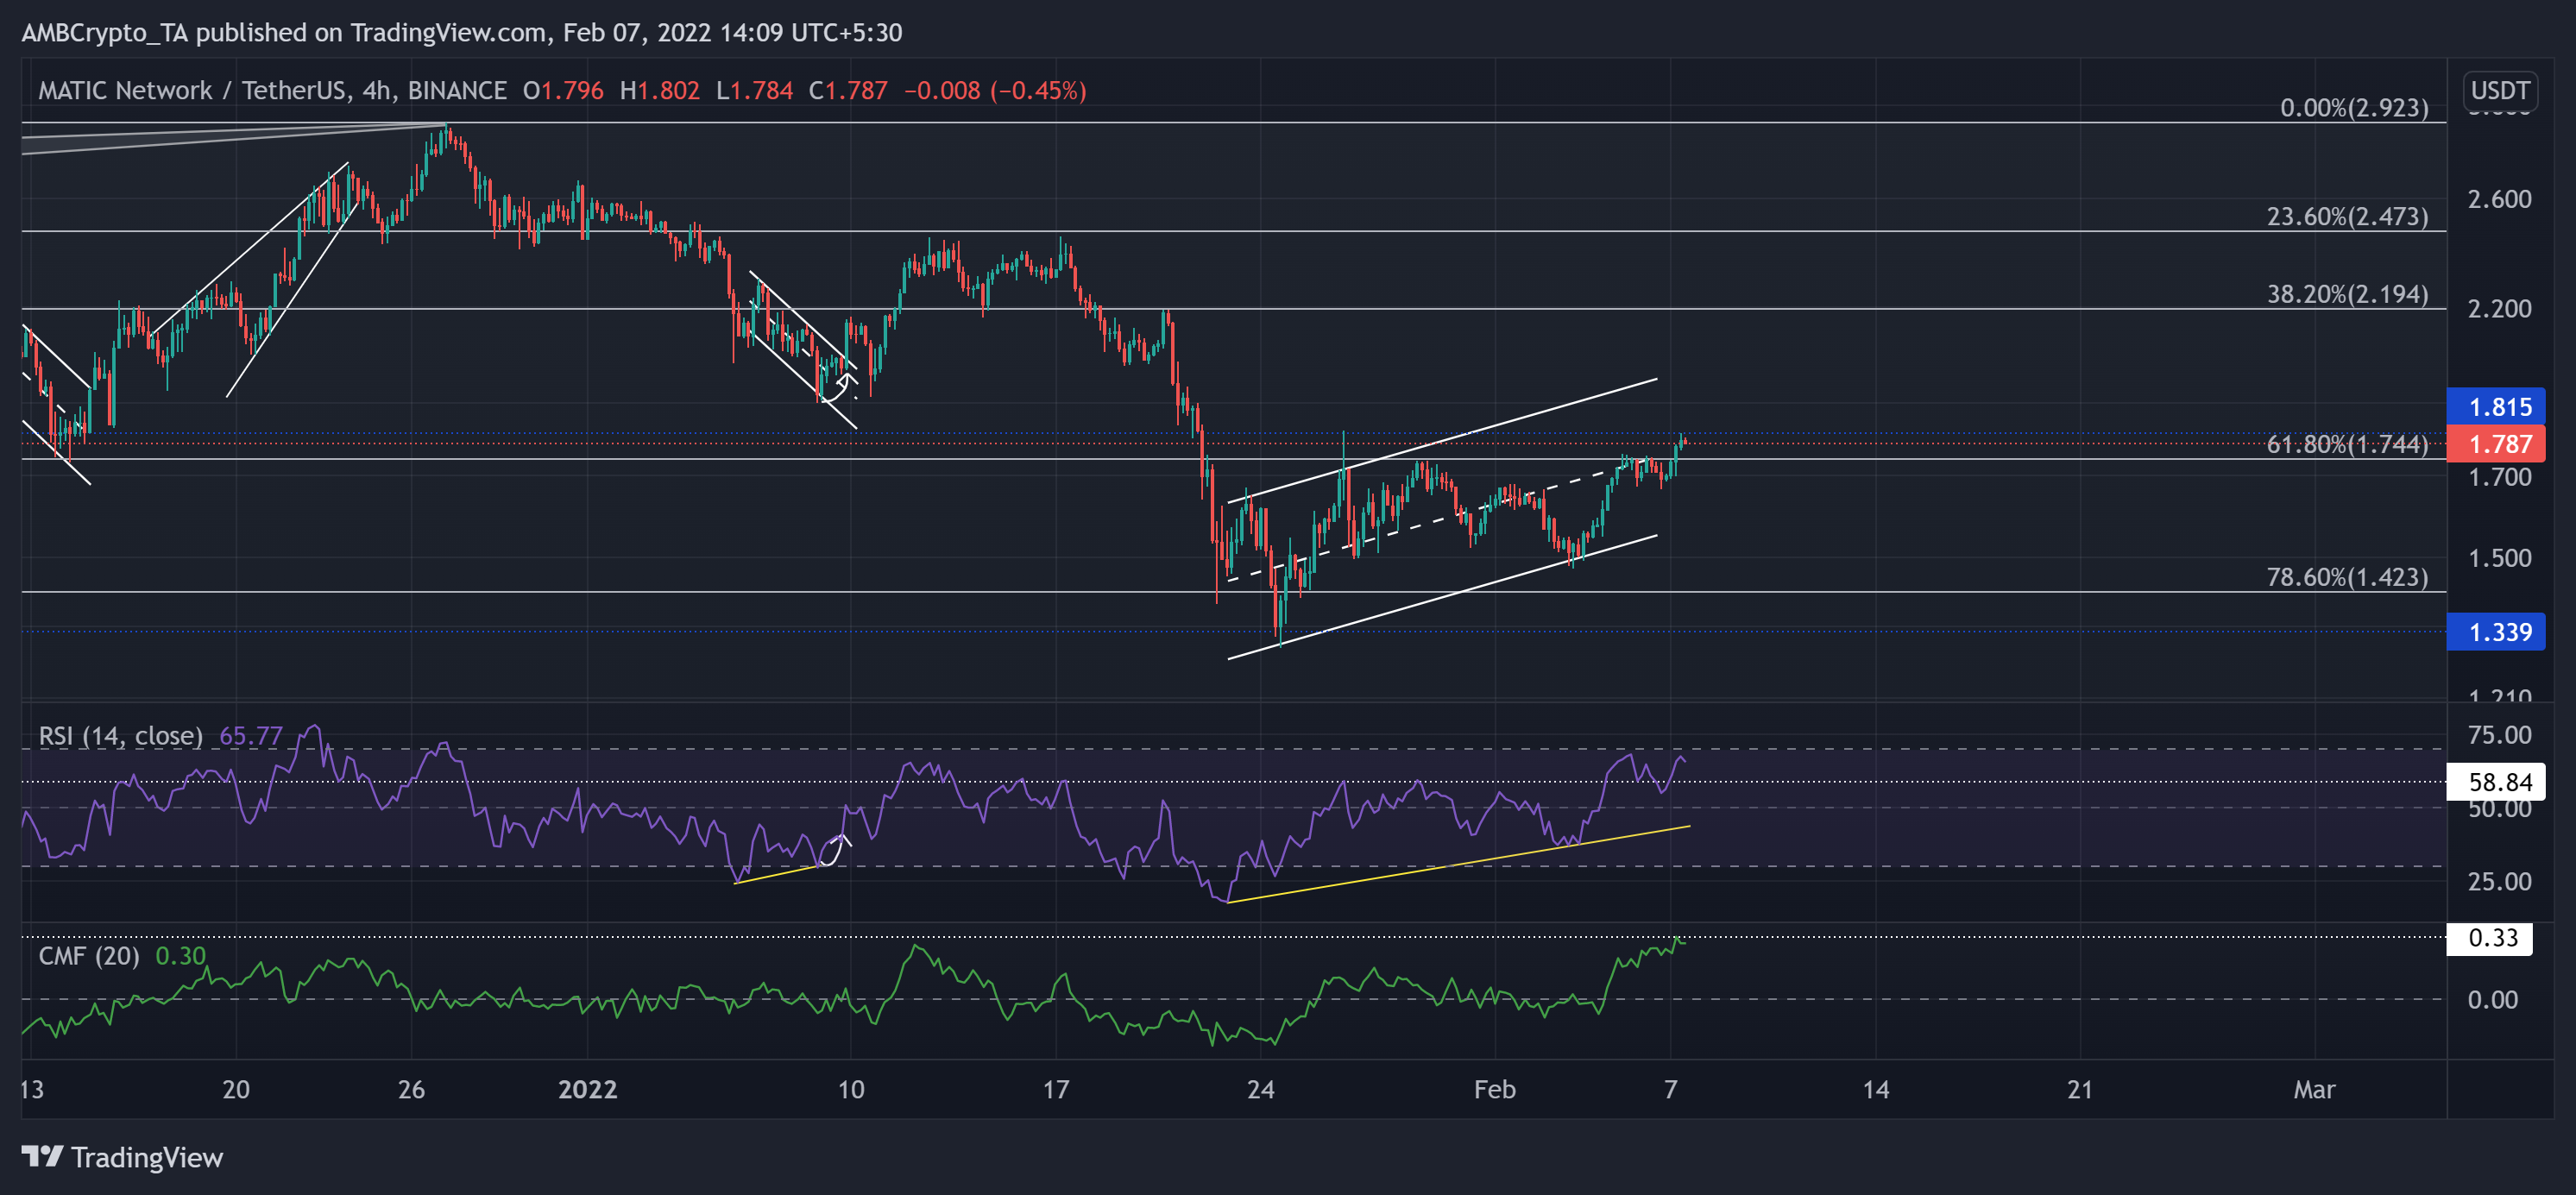
After attaining its ATH on 27 December at $2.92, MATIC fell to register a 54.24% decline and hit its three-month low on 24 January.
MATIC saw a 39.6% ROI in the last two weeks after bouncing back from its long-term $1.3-support. Thus, it reclaimed the 78.6%, 61.8% support level but struggled to cross the $1.8-level. Any fall below the golden Fibonacci level could lead to a retest of the lower trendline of the up-channel (white).
At press time, MATIC traded at $1.787. The RSI steeply surged and reversed from the overbought region. Further, the CMF exponentially grew to poke its ten-week high on 7 February, depicting a record high money volume for the alt.
Tron (TRX)
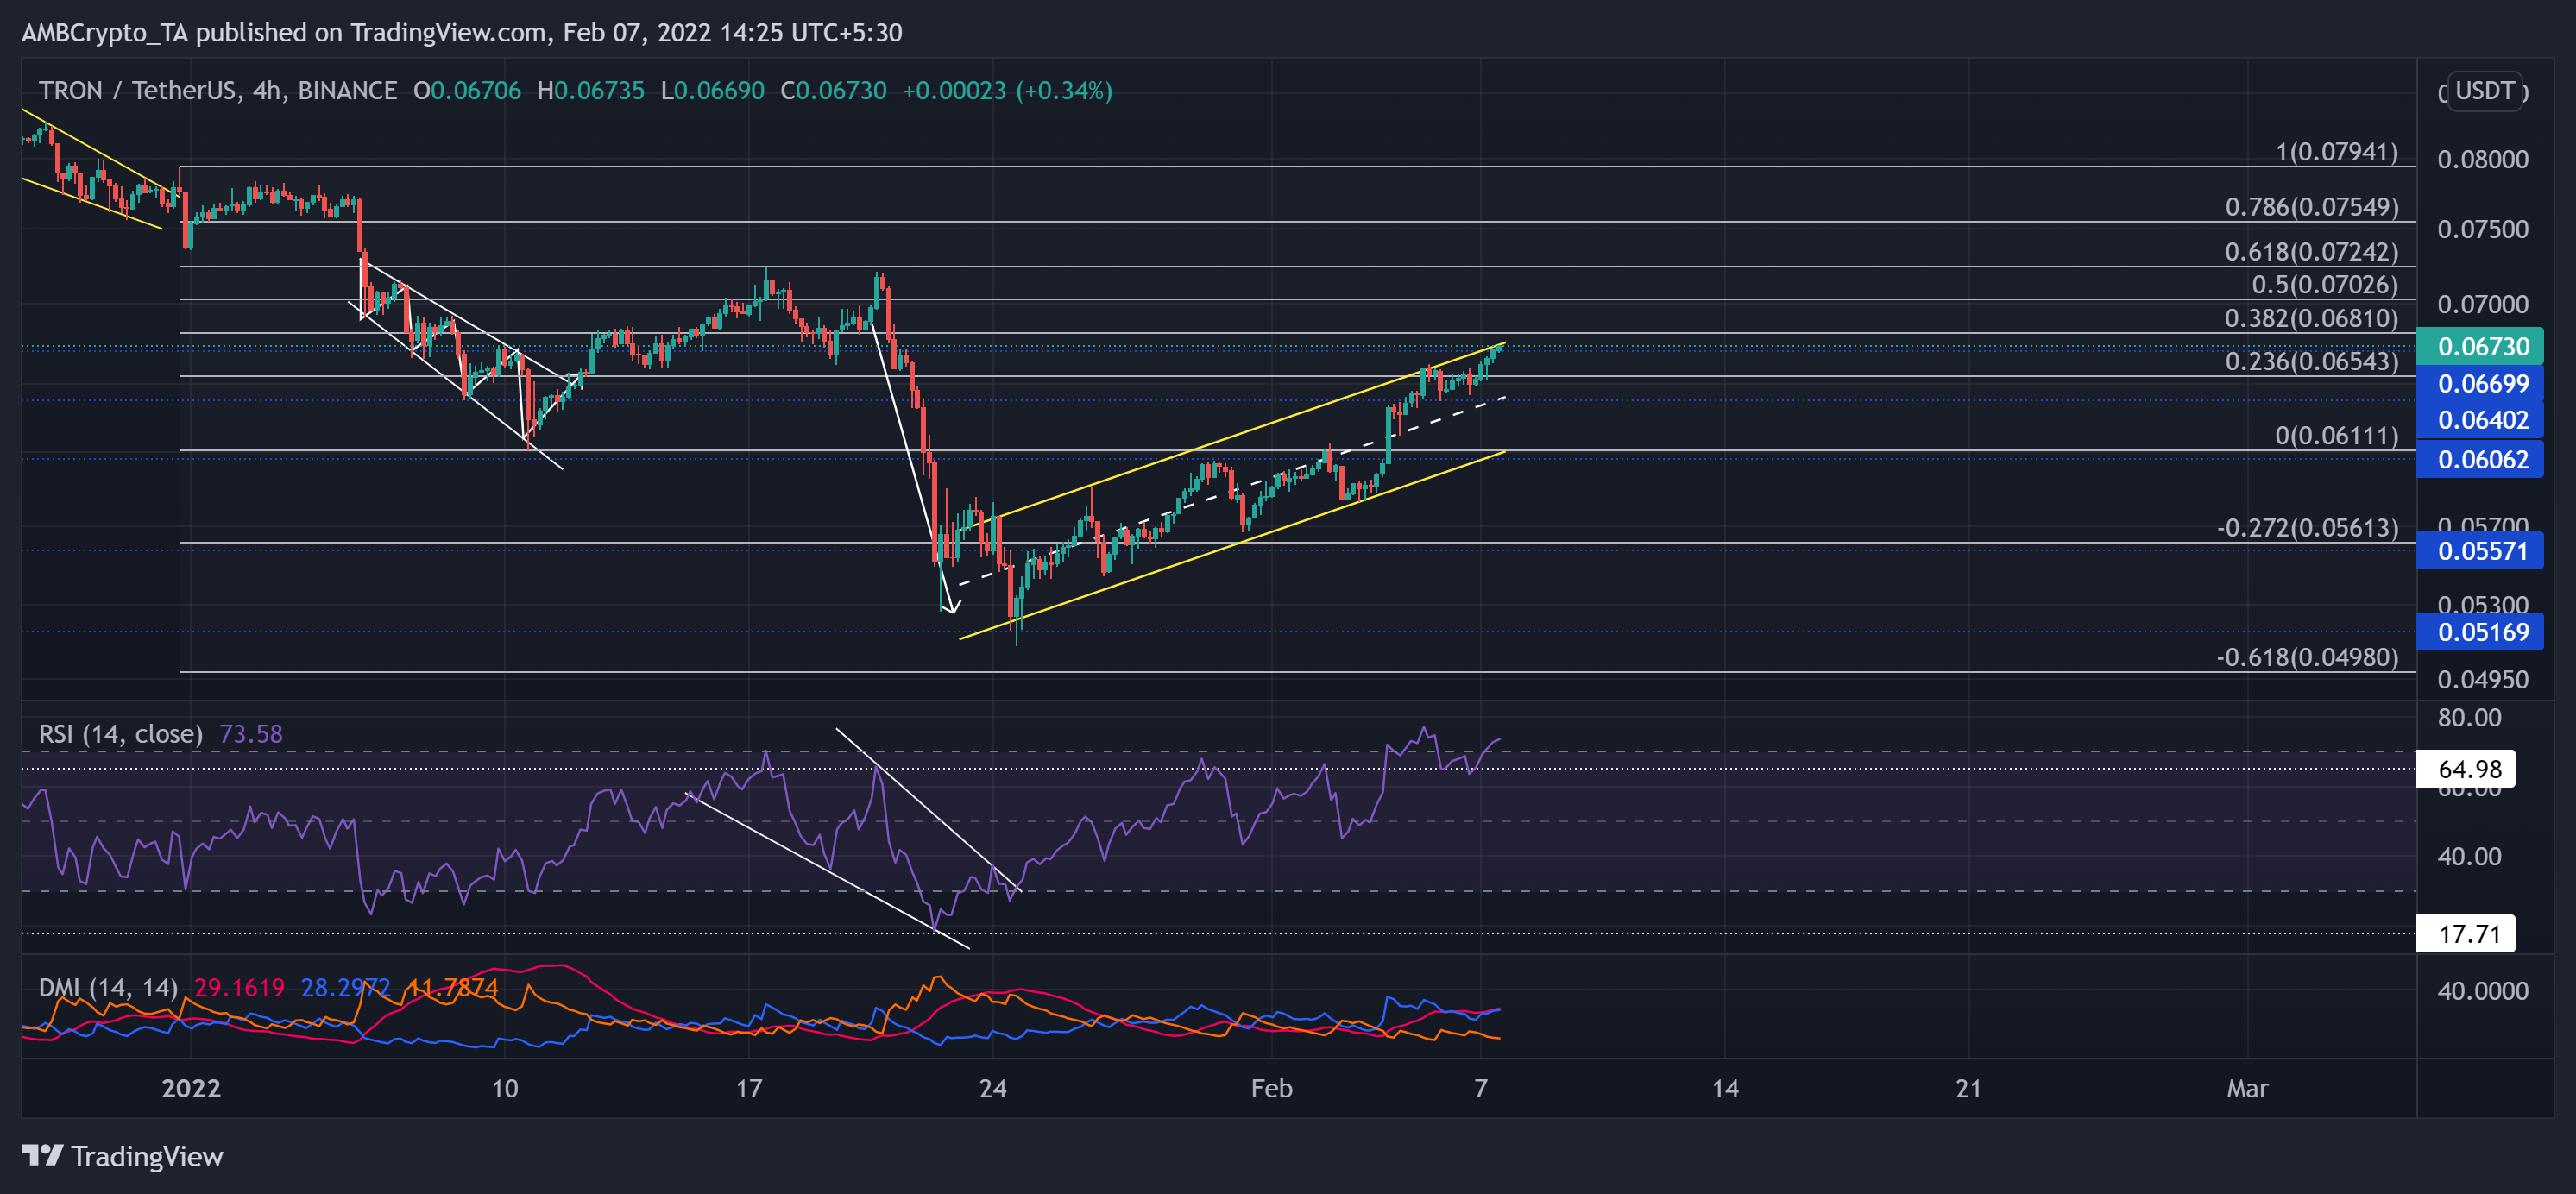
After reversing from the 61.8% Fibonacci resistance on 20 January, TRX correlated with the broader trajectory and steeply declined. The alt registered a 28.2% decline in just four days and touched its six-month low mark on 24 January.
Since the sell-off, TRX witnessed an ascending channel on its 4-hour chart. Unless the bears dwindled, the immediate resistance stood at the upper trendline of the up-channel, followed by the 38.2% Fibonacci level.
At press time, TRX was trading at $0.0673. after the falling wedge breakout, the RSI marked a staggering growth. It flipped the 64-mark from resistance to immediate support, hinting at a strong bullish vigor.
With the +DI looking north and in the opposite direction of -DI, TRX would justify a near-term bullish movement.