Solana’s price gallops past $80: What does SOL’s prediction hold?

- Solana maintained its uptrend on the 12-hour and daily price charts.
- Certain Fib extension levels could stall the bulls for a while, or even force a reversal.
Solana [SOL] broke out of a range it consolidated within two weeks ago and rallied past the $80 mark. This level had acted as a strong resistance level in the past ten days but was breached after Bitcoin [BTC] climbed above the $42k resistance.
In other news, Solana broke the stablecoin transfer volume record. Furthermore, its TVL was also in a continuous uptrend, showcasing increased adoption and usage.
December could see SOL climb above $100
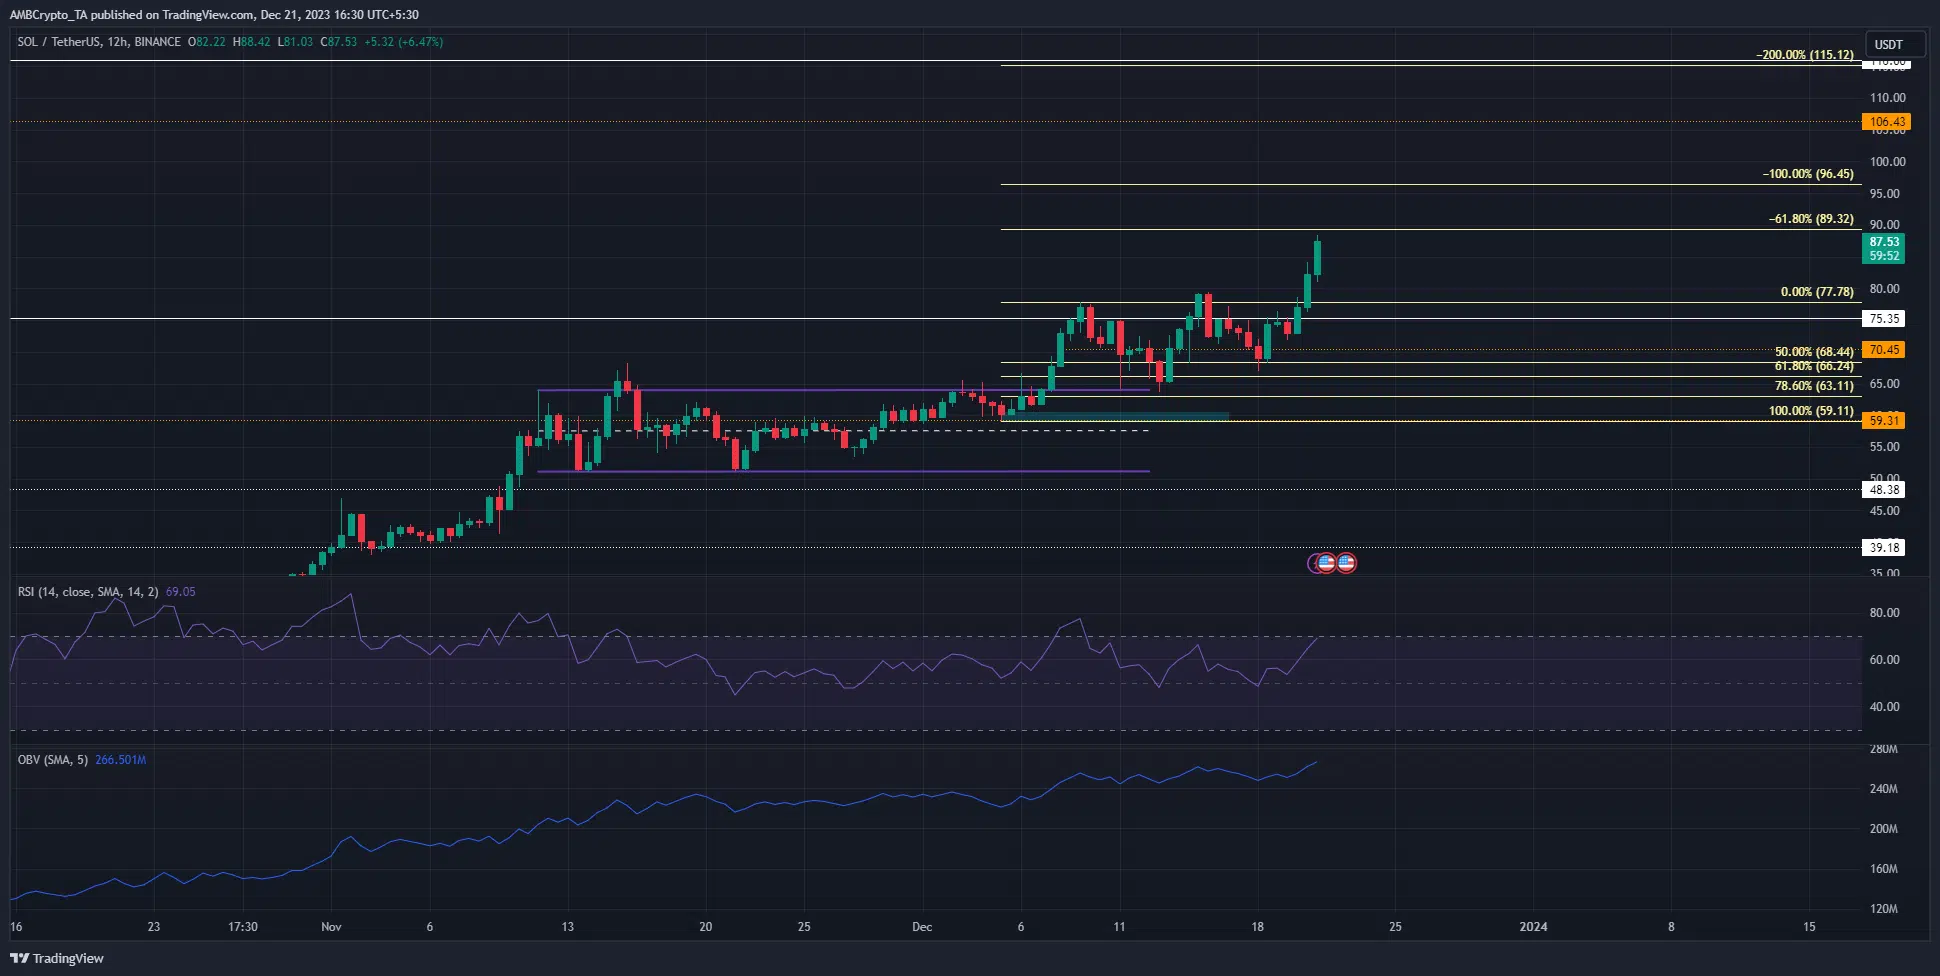
Solana managed to breach the local high at $79.5 registered on the 20th of December. It fell to $67 on the 18th of December, but the prices have increased since. The RSI touched the neutral 50 mark during that drop, but didn’t drop below it.
The technical structure was also bullish on the 12-hour chart. The OBV also trended higher to reflect steady buying pressure on SOL. The Fibonacci extension levels (pale yellow) 61.8% and 100% at $89.32 and $96.45 are the next targets.
Further north, the $103-$106.5 resistance zone was another HTF area in bearish control. It served as resistance in April 2022 and could do so again.
The short-term outlook showed bullish expectations were intense

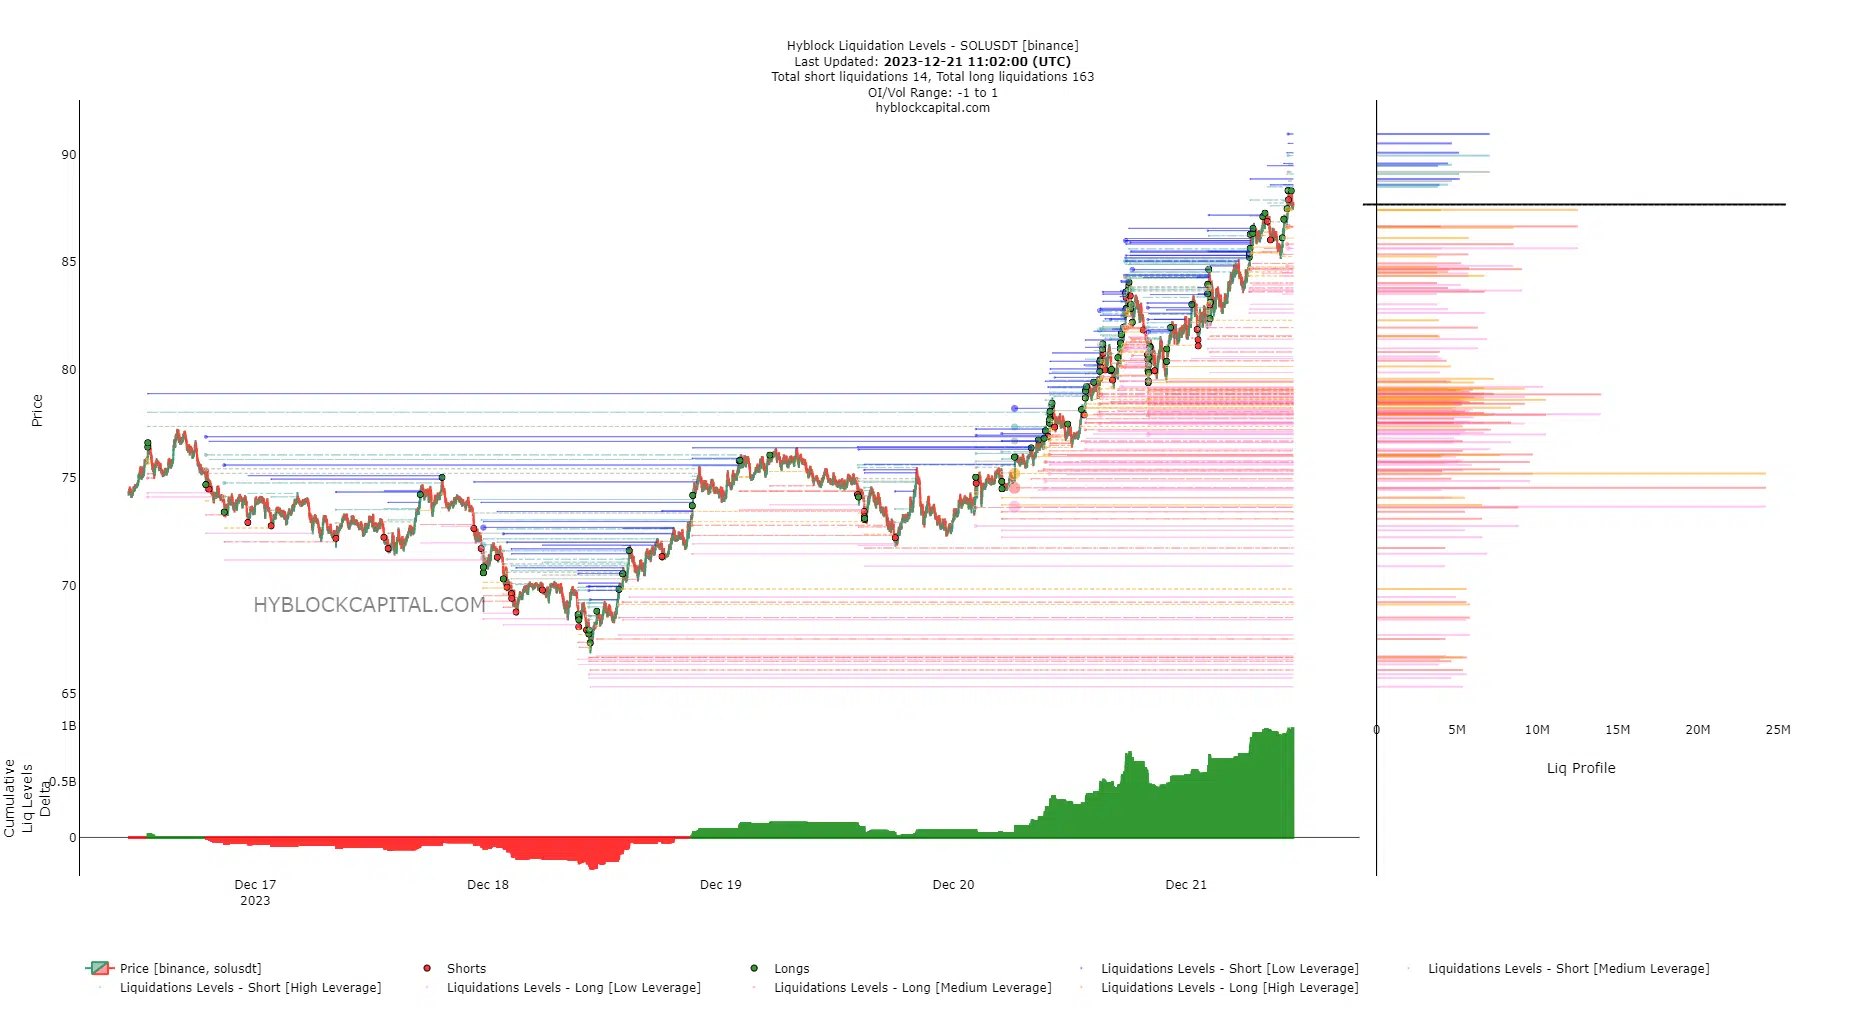
Source: Hyblock
AMBCrypto’s analysis of the liquidation levels from Hyblock showed that bulls were overwhelmingly strong. The Cumulative Liq Levels Delta had been hovering around the zero mark on the 19th of December but shot higher in the past two days.
This meant that bulls were confident of further short-term gains, but could experience pain in case of a minor dip.
Realistic or not, here’s SOL’s market cap in BTC’s terms
Therefore, a move southward would put massive pressure on the overleveraged long positions and could yield liquidity. The 83.7-$85.35 pocket has some liquidation levels, with multiple 10M+ liquidations estimated.
Similarly, the $77-$79.6 zone had multiple 15M+ liquidations estimated. Hence, SOL could descend to these levels before a reversal.
Disclaimer: The information presented does not constitute financial, investment, trading, or other types of advice and is solely the writer’s opinion.


