Solana prices continue to drop after Christmas: New year predictions?

- Solana retained its bullish bias despite the drop below $107.9.
- This dip shifted the market structure but buying pressure remained dominant.
Solana [SOL] has been on a remarkable run since late September. After breaking past the $80 resistance zone on 20th December, the bulls wasted no time in driving SOL past $100. It reached $126 on 25th December.
Its YTD return was over 120%, as this time last year SOL was weighed down after the FTX collapse. Its on-chain activity was powerful, and AMBCrypto noted that the network growth reached a monthly peak in December.
The fair value gap drew SOL prices lower
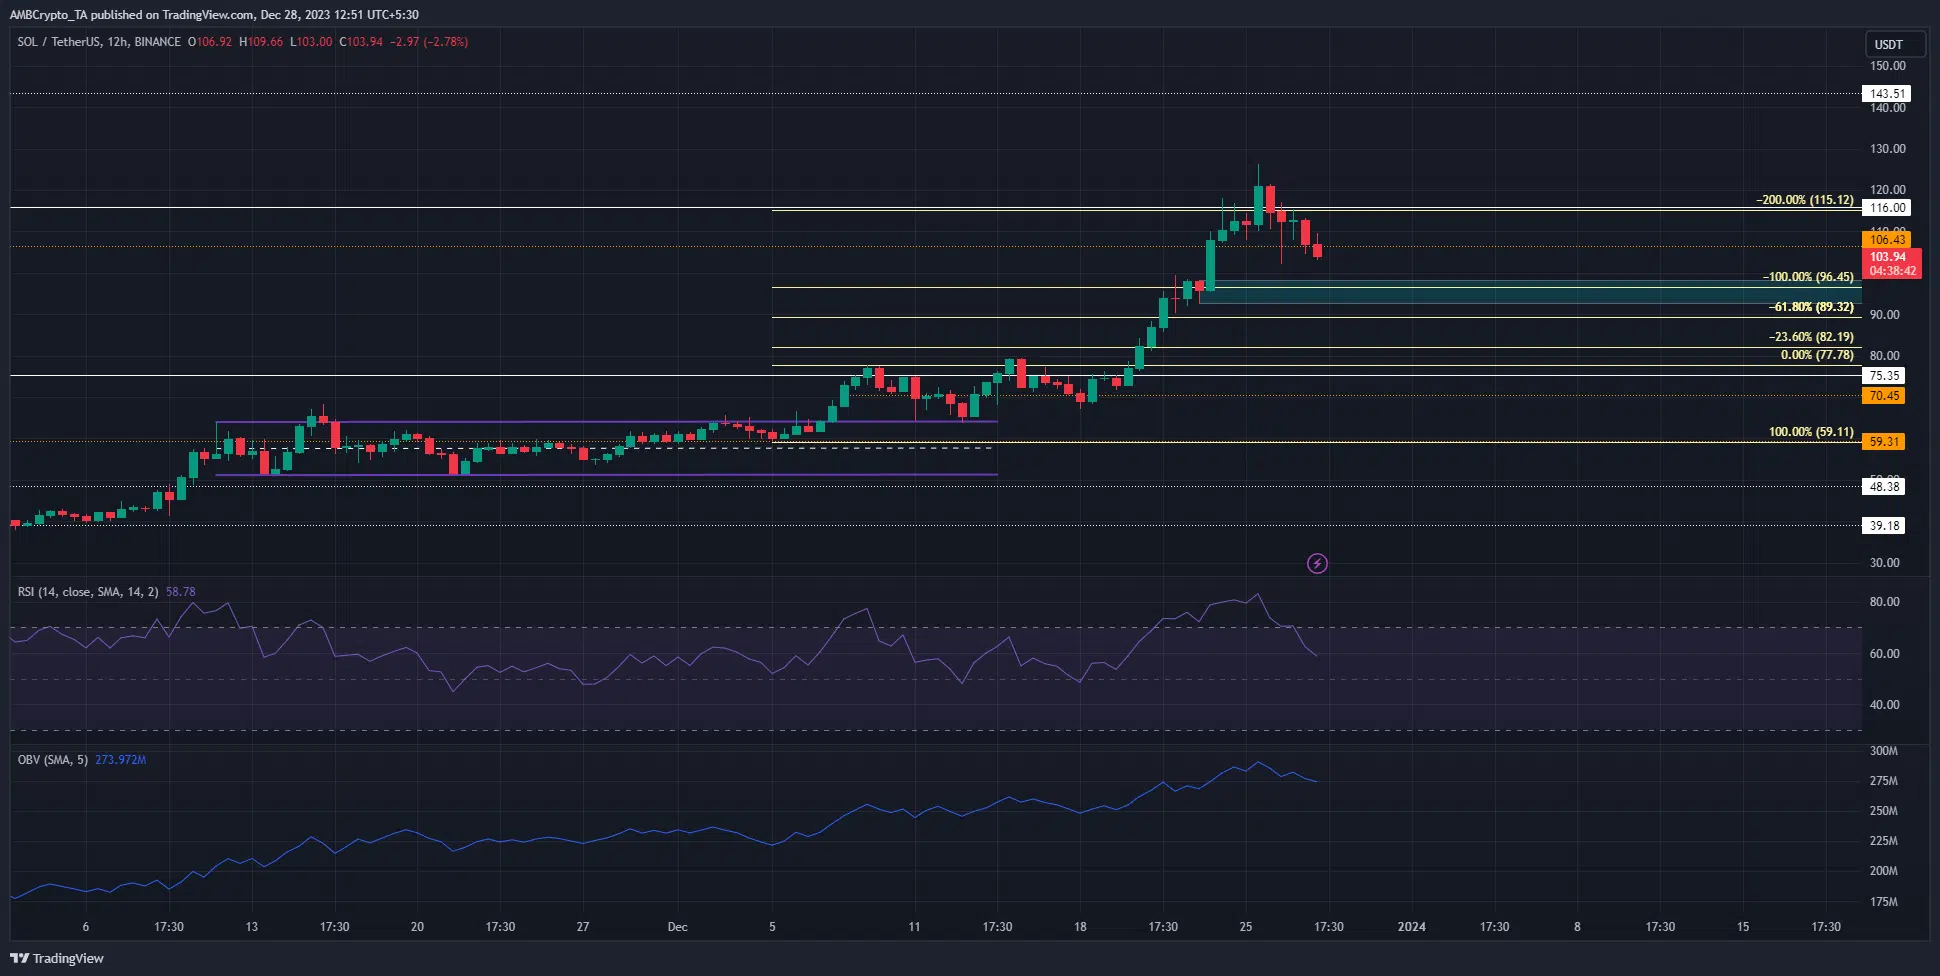
On 23rd December, Solana prices surged higher from $95.28 to $110. This movement northward continued over the next couple of days, leaving SOL no time to fill the fair value gap it left on the 12-hour chart. This gap reached from $98.22 to $107.3.
The 50% level of this gap sat at $102.76 and is a technical target for the current dip that SOL is on. Lower than $100, the $93-$98 also presented a good argument for buying SOL. It had been a lower timeframe consolidation zone before the large breakout.
The market structure of SOL has shifted bearish on the 12-hour chart. The RSI continued to move above neutral 50 to indicate buyers were in control.
The OBV also showed that the recent losses did not come on the back of intense selling pressure. Instead, it was likely that SOL could climb higher again.
The $100 level was not just a psychological support level

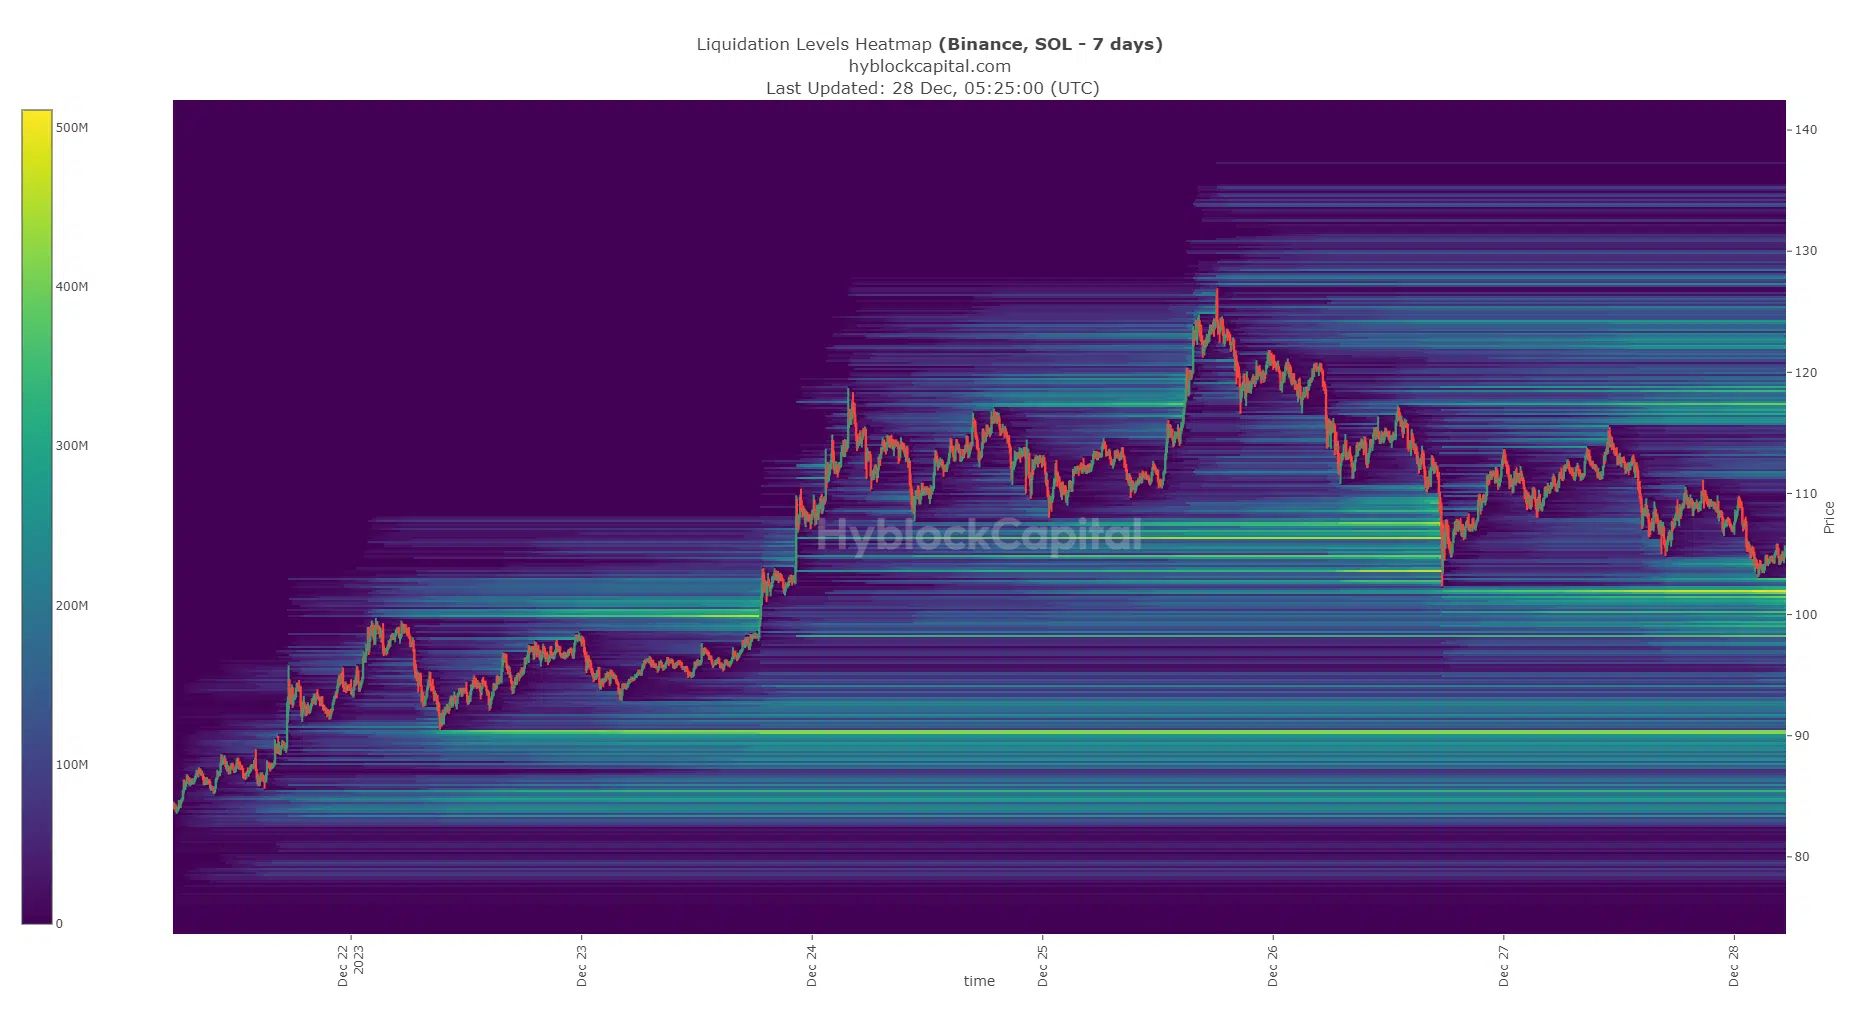
Source: Hyblock
AMBCrypto’s analysis of the liquidation heatmap showed that the $100-$103 region was critical. This area held a large amount of estimated liquidation levels.
Hence, SOL could dip just below $100 to collect this liquidity before climbing upward.
Is your portfolio green? Check the SOL Profit Calculator
Below $98.2, the next area of interest was $90.3, gauging by the significant amount of liquidation levels. A drop below $90 could see SOL revisit the $70 support region.
On the other hand, a successful defense of the $100 area could see SOL rally toward $143, the next long-term resistance level.
Disclaimer: The information presented does not constitute financial, investment, trading, or other types of advice and is solely the writer’s opinion.


