Solana, Shiba Inu, MANA Price Analysis: 02 January
With Bitcoin still striving to snap off its immediate resistance at the $47,900-level, the overall sentiment failed to exhibit a bullish inclination.
Solana fell below its near-term Point of Control, while Shiba Inu bulls still needed a sustained close above its 50% Fibonacci support. Decentraland, on the other hand, flashed mixed signals.
Solana (SOL)
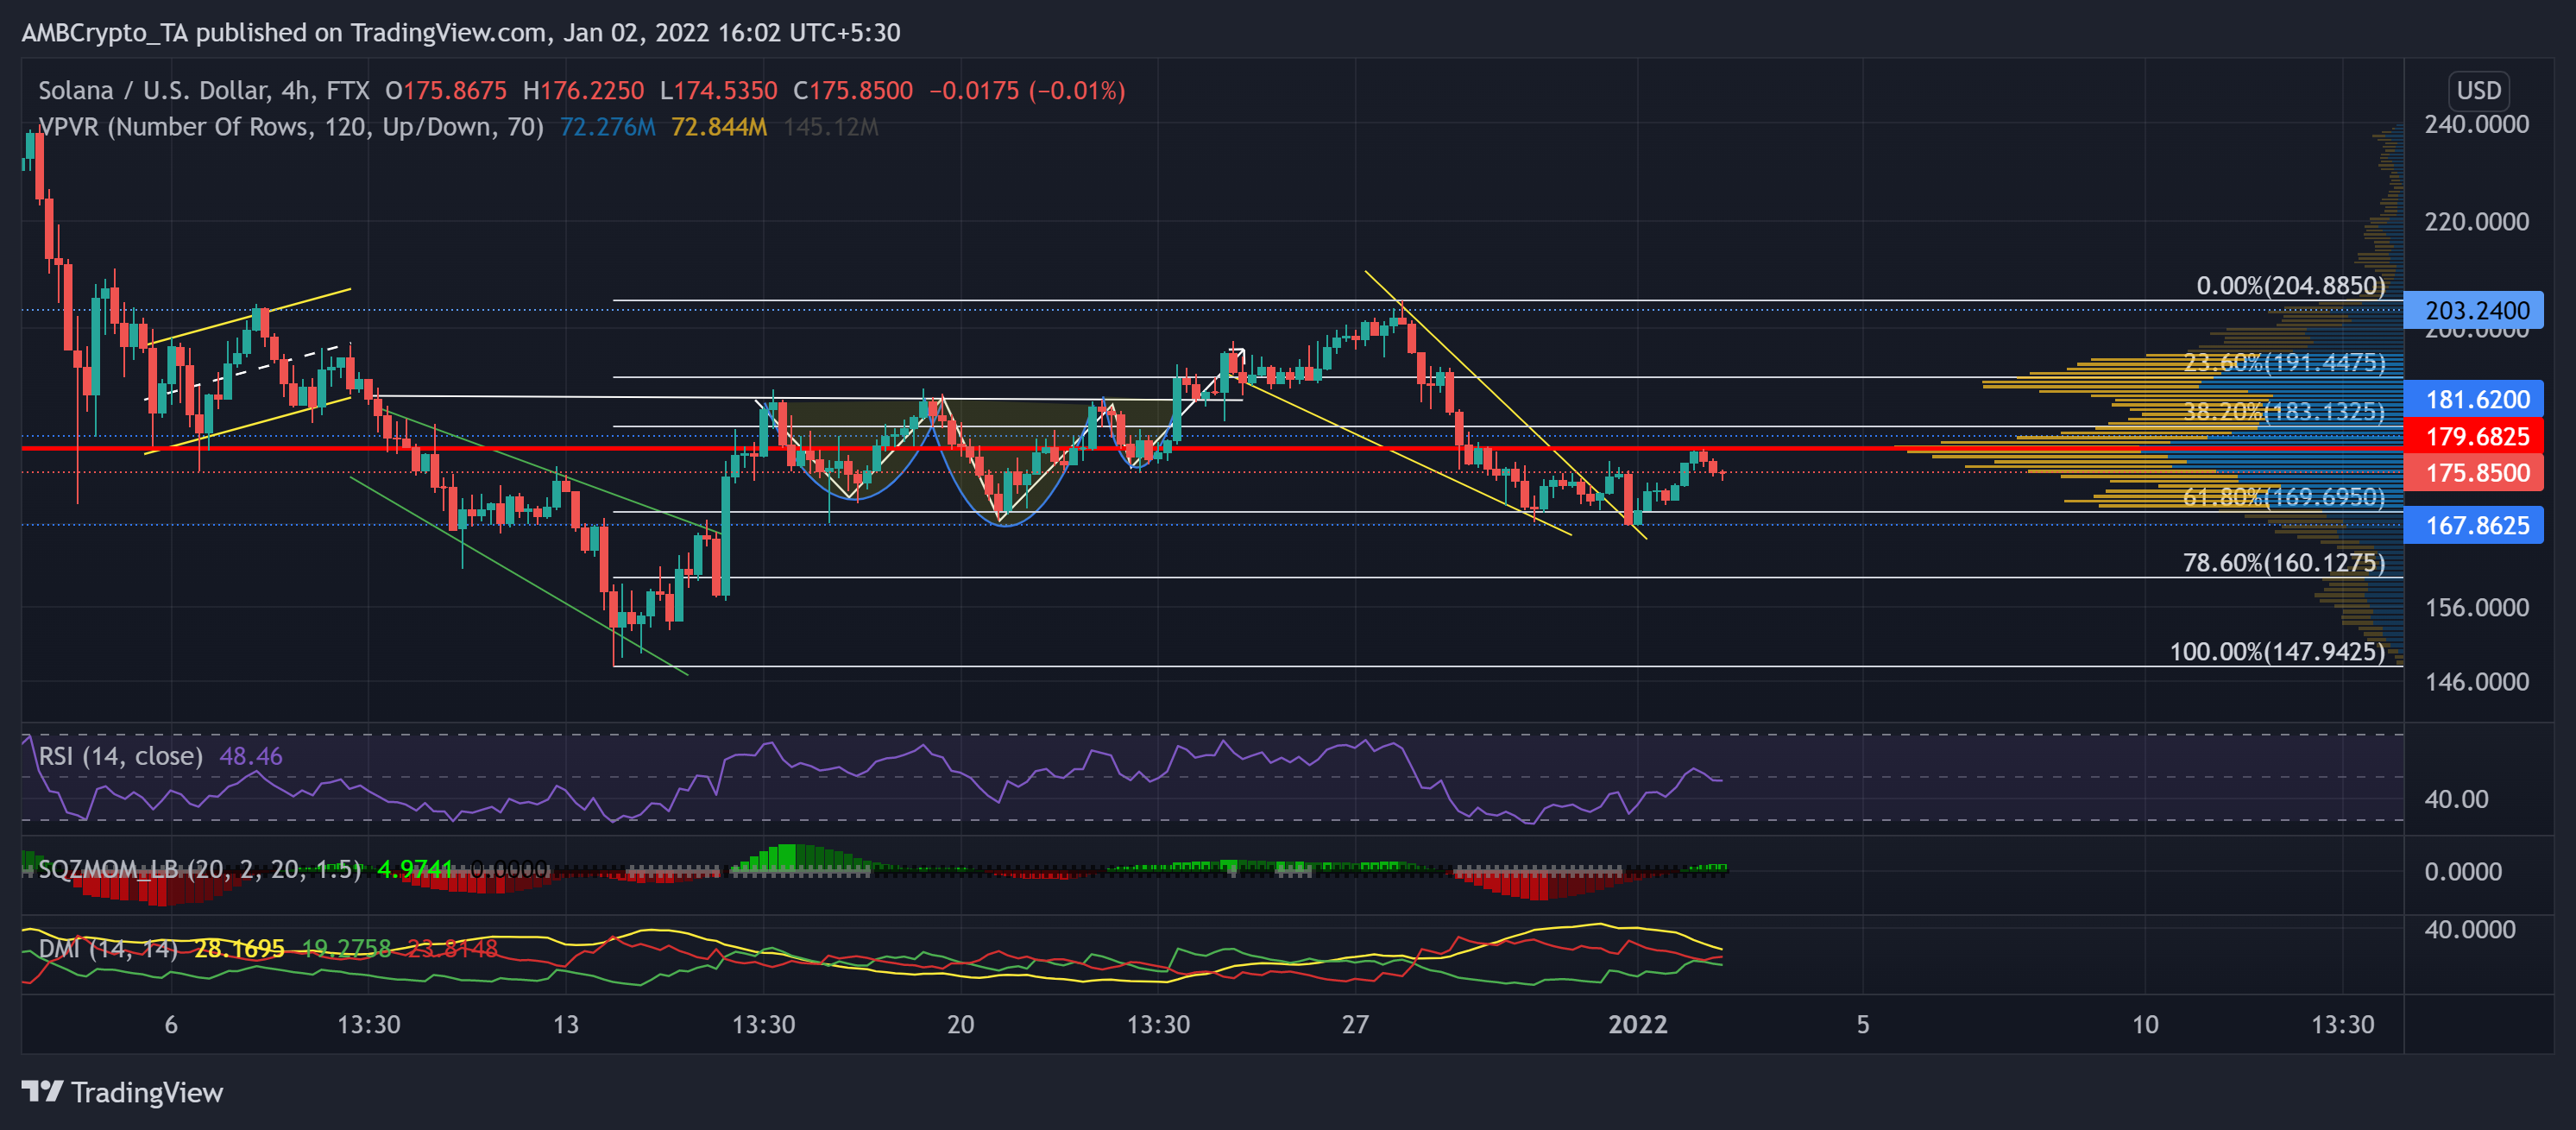
The inverse head and shoulder breakout halted at the month-long resistance near the $203-mark. Since then, SOL retraced by over 18.5% until it poked its two-week low on 31 December.
After losing the 23.6%, 38.2% Fibonacci supports, the price action fell below its Point of Control (red) at the $180-level. Further, the falling wedge breakout came to rest at the above level that acted as immediate resistance.
Regardless of the pullout, the bulls have ensured the 61.8% Fibonacci support near the $167-level for a while now.
At press time, the alt traded at 175.85. The RSI was just below the midline after failing to sustain itself above the 50-mark. Also, the DMI showed a bearish vigor. However, Squeeze Momentum Indicator flashed a low volatility phase.
Shiba Inu (SHIB)
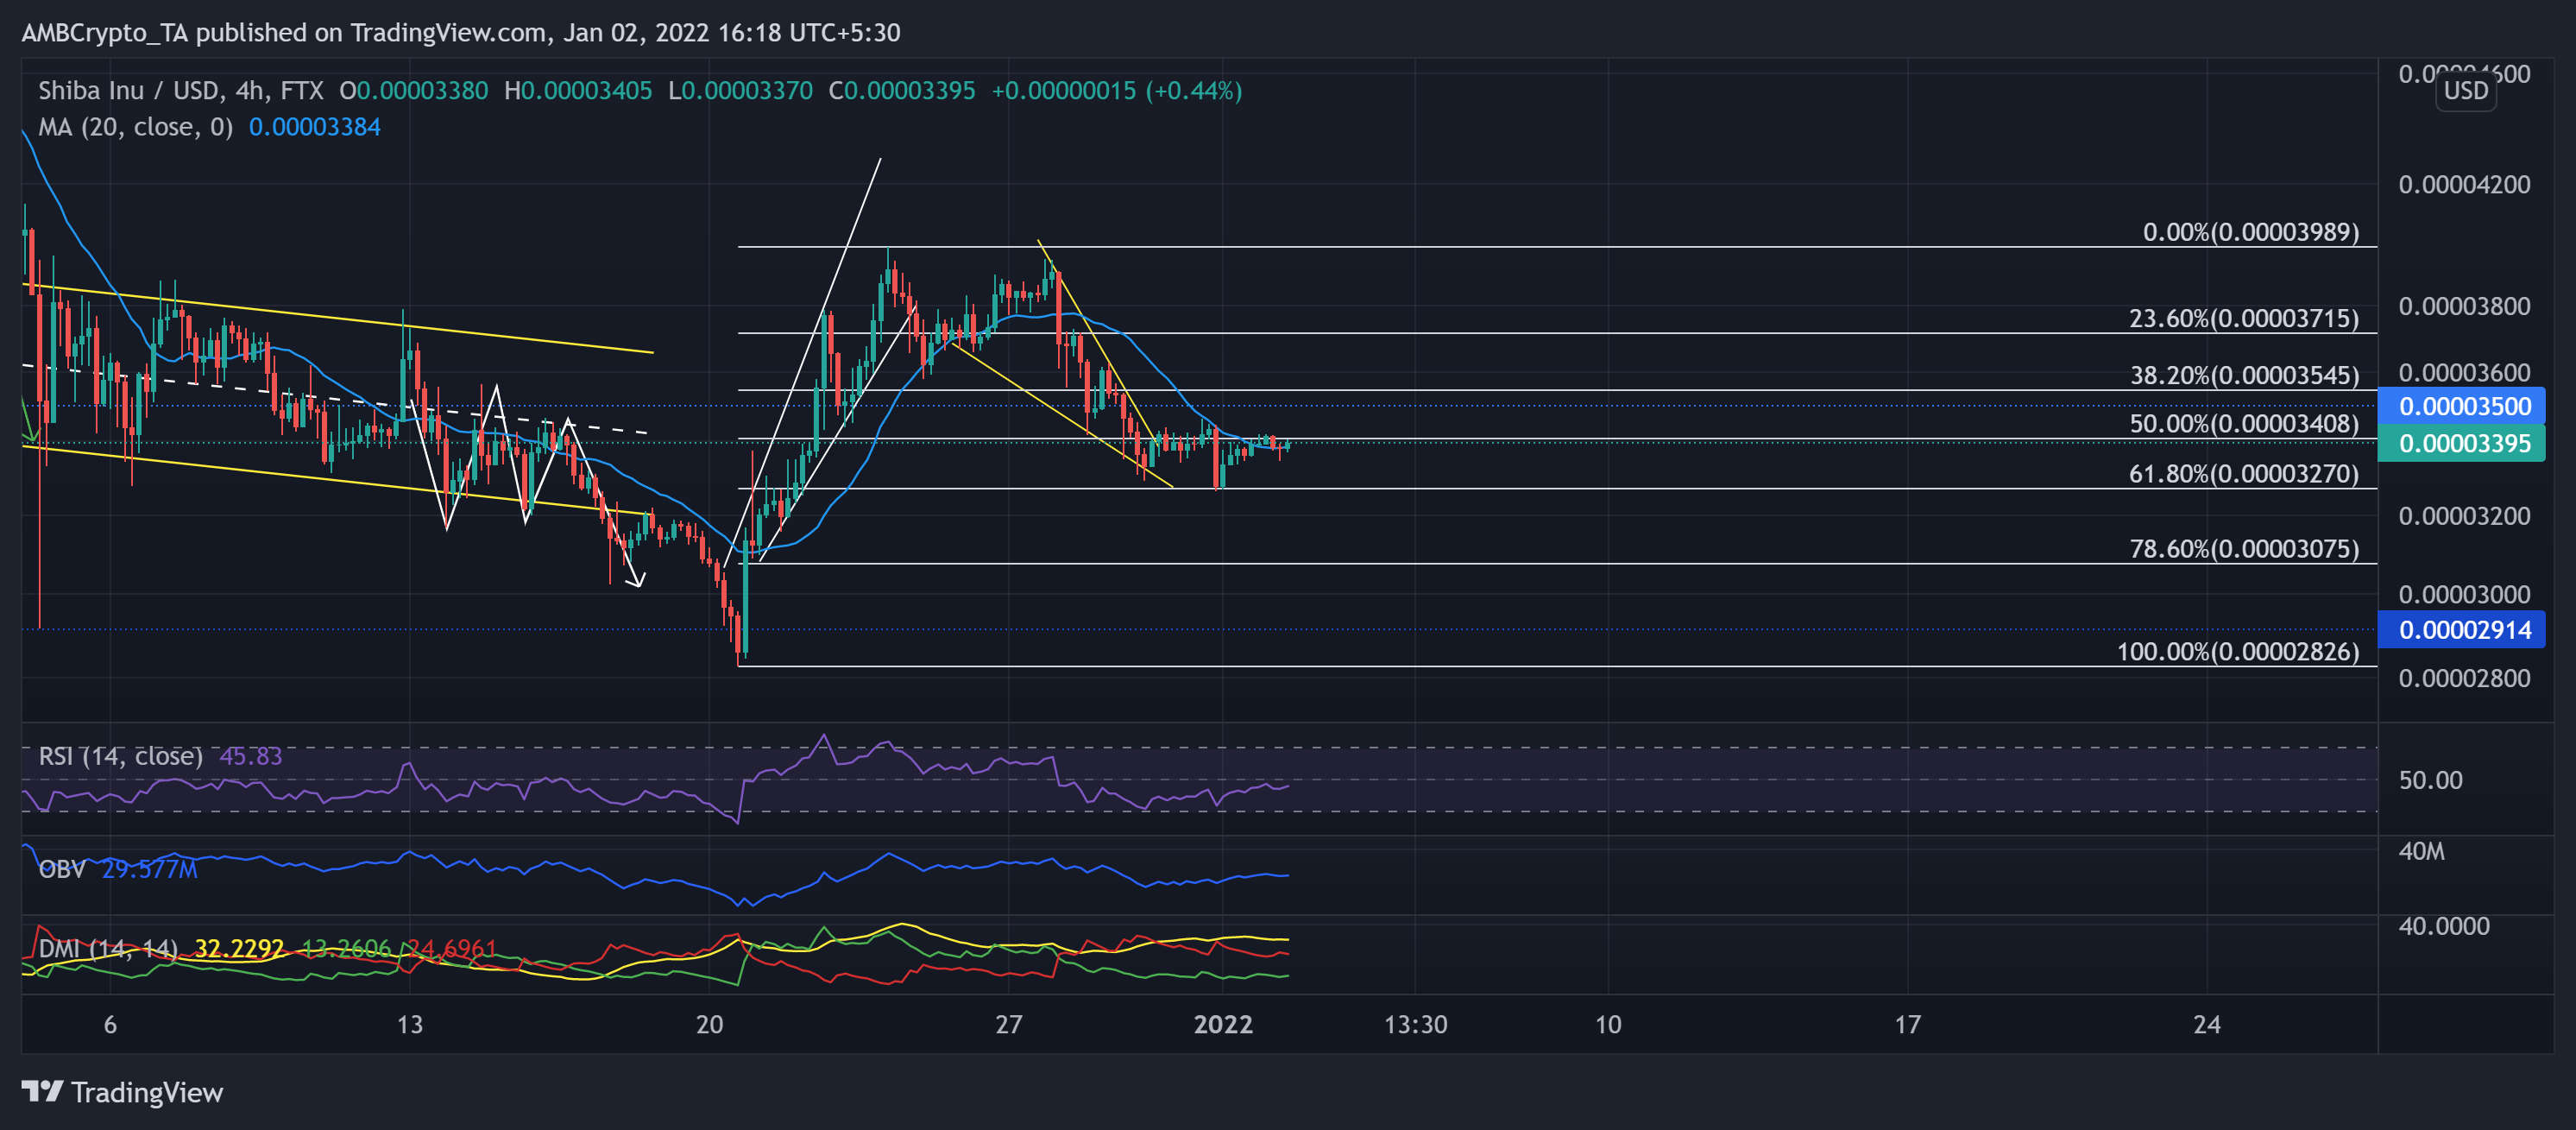
After a substantial 28 December sell-off, SHIB bulls flipped the vital $0.000035 nine-week support to its immediate resistance.
After finding long-term support at the $0.000029-level, SHIB exponentially grew in a rising wedge. Accordingly, the price action saw a 39.12% jump from this level and poked its three-week high on 24 December.
Now, the $0.00003408-level showed a strong resistance as the price action saw a pullback after testing it multiple times over the past week. SHIB needed a sustained close above its 50% Fibonacci support to confirm the strength of the falling wedge breakout.
At press time, SHIB traded at $0.00003395. The RSI swayed near the 45-mark. Further, the DMI favored the sellers while the OBV marked higher troughs and peaks in the last two days.
Decentraland (MANA)
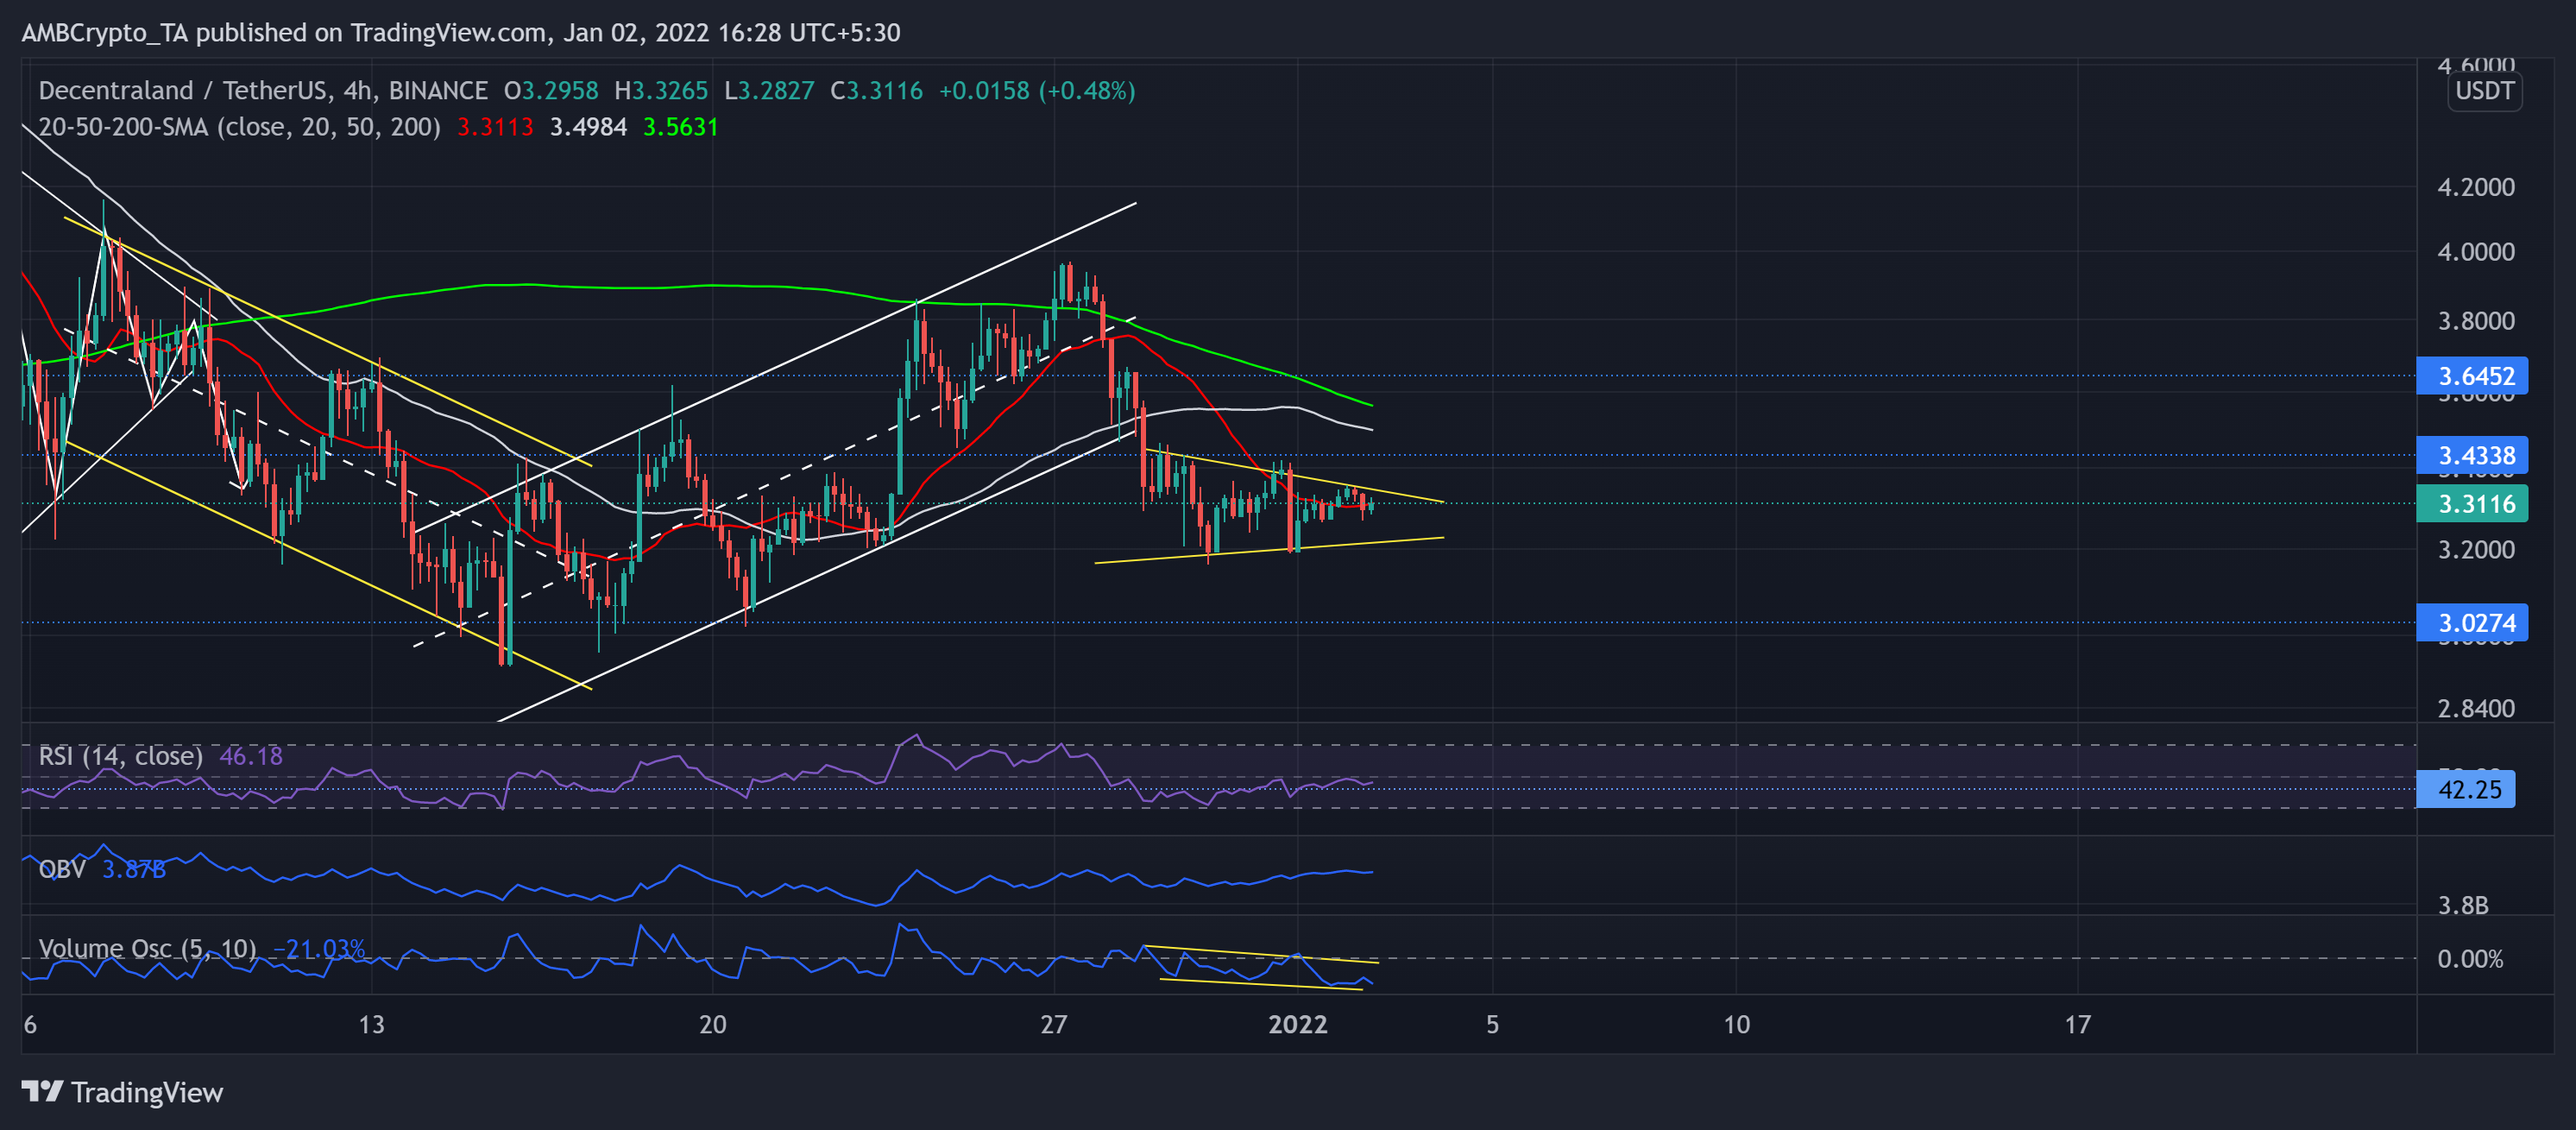
MANA halted its steep downturn at its one-month support at the $3.02-mark. As the price recovered from this level, it oscillated in an up-channel for nearly ten days until it breached the $3.6-mark.
The alt marked a 16.94% retracement after touching its three-week high on 27 December. With this fall, MANA fell below its 20-50-200 SMA. The immediate testing point for the bulls now stood near the 20 SMA (red) at the $3.3-mark. On its 4-hour chart, the alt marked a symmetrical triangle over the past few days.
At press time, MANA traded at $3.3116. The RSI flashed a bearish bias but managed to breach the resistance at the 42-mark. The OBV depicted an increase in buying pressure. But the Volume Oscillator has been on a downtrend, hinting at a weak bullish motion.