Solana [SOL]: A detailed analysis of how the chain fared in Q3
A Q3 assessment of Solana showed growth in its user activity and NFT activity. The proof-of-history blockchain, however, recorded declines in its TVL, revenues, and transaction fees within the same period
![Solana [SOL]: A detailed analysis of how the chain fared in Q3](https://ambcrypto.com/wp-content/uploads/2022/10/guerrillabuzz-blockchain-pr-agency-5_asf_AsG-I-unsplash-1.jpg)
House to over 350 decentralized applications (dApps), a new report from Messari revealed that leading open-source blockchain Solana [SOL] saw growth and some corresponding declines in Q3.
Titled “State of Solana Q3 2022,” Messari found that the bearishness that marked Q3 “highlighted the network’s fundamental user base and ability to advance its growth strategy.”
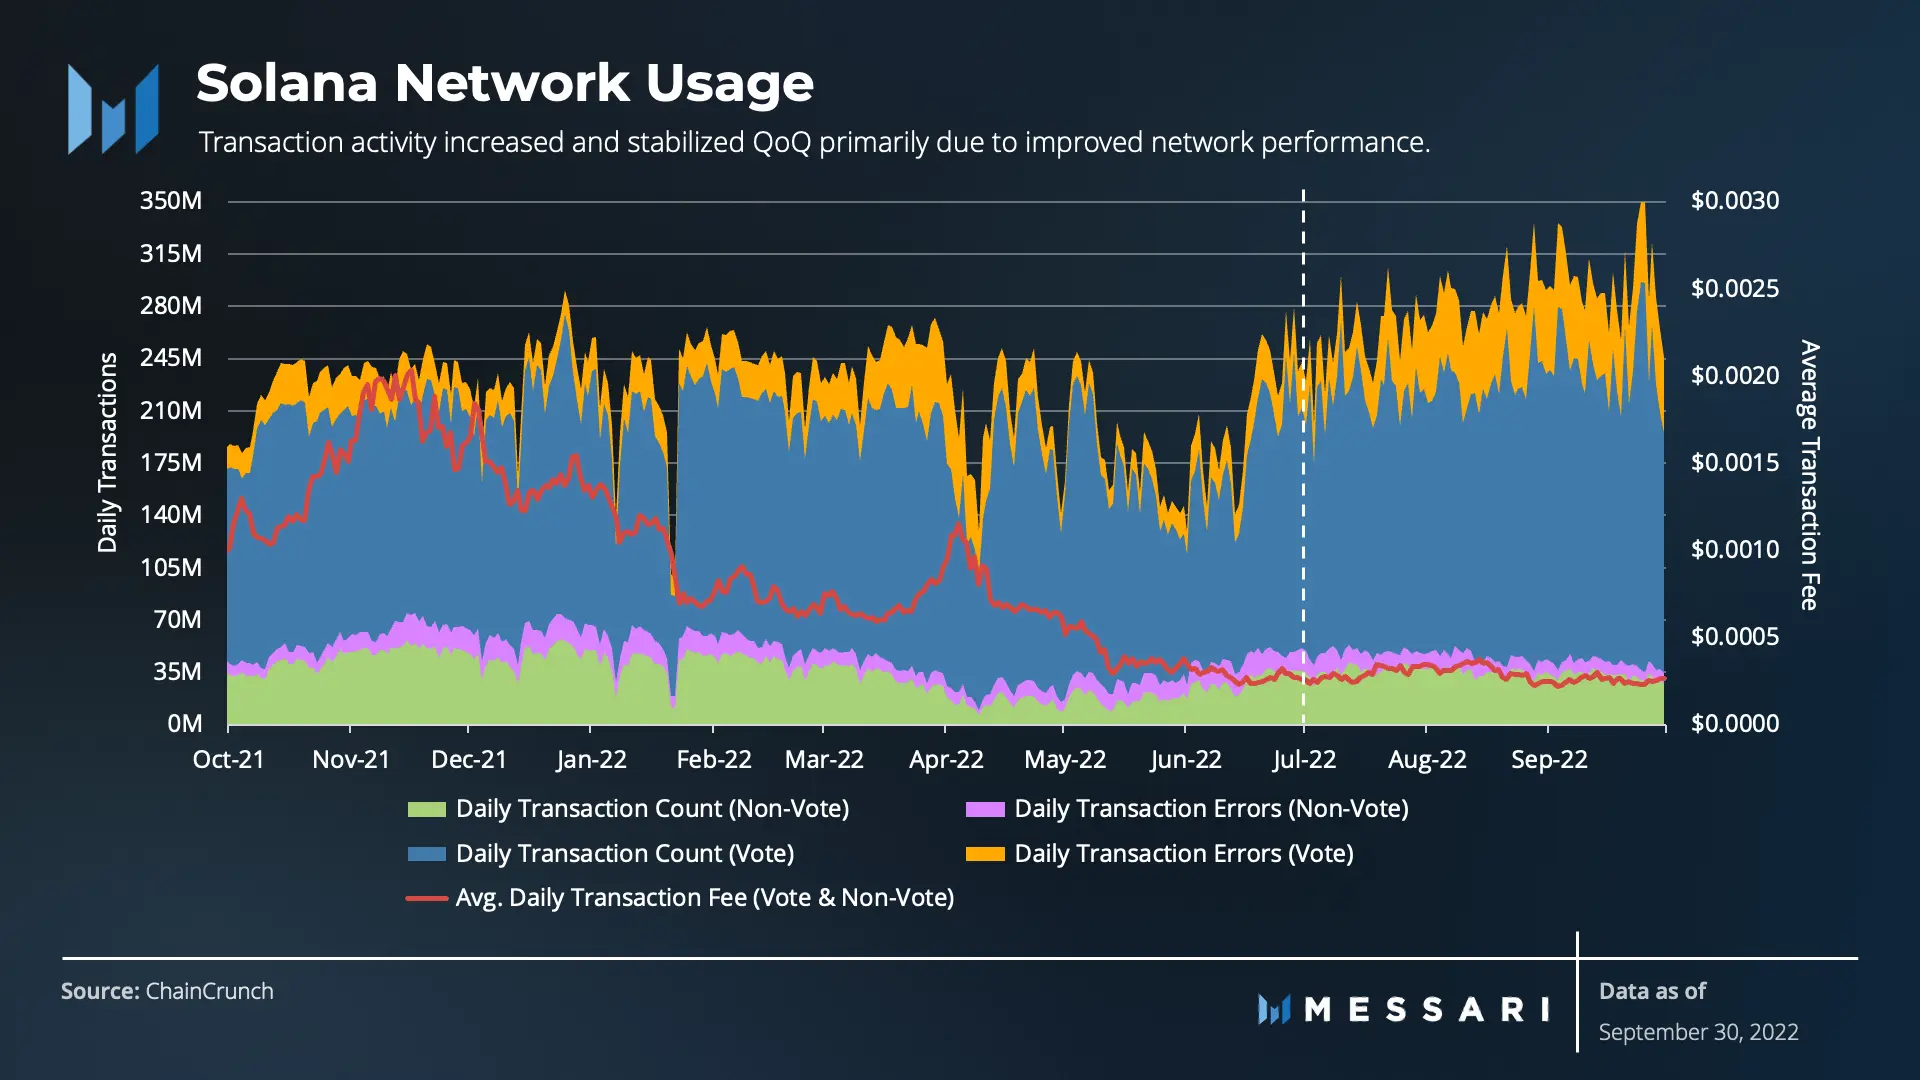
As for the areas it saw growth, Messari found that non-vote transactions on Solana went up by over 70% in Q3 over the previous quarter, wherein the same suffered “drastic volatility.”
Also, transactions-per-second (TPS) on Solana clinched an all-time high in Q3, with an average of around 3200 transactions processed per second on the proof of history network.
According to Messari, TPS was up 40% over the previous quarter. On what might be responsible for the growth in transaction activity on Solana, Messari found that,
“Transaction activity increased and stabilized QoQ primarily due to improved network performance rather than more users.”
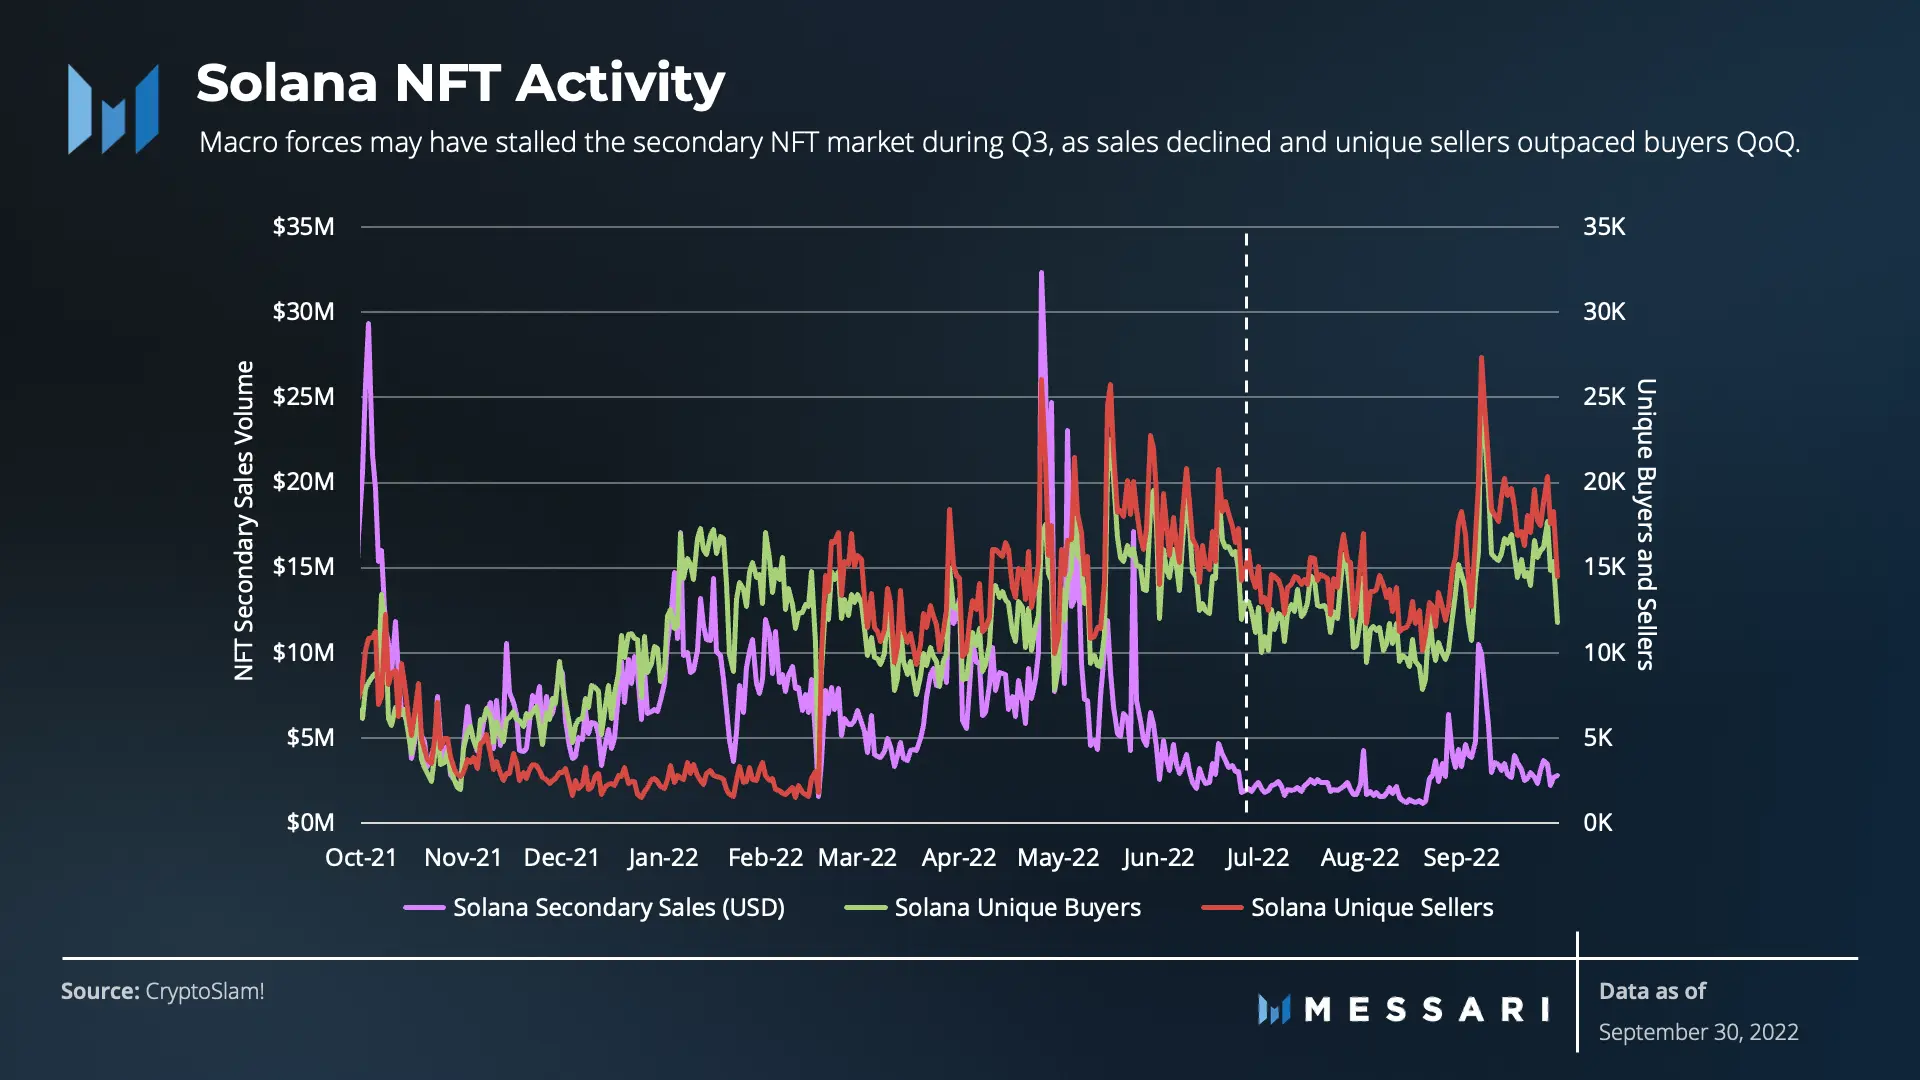
Furthermore, even as general interest in PFP NFTs waned in Q3, Solana’s NFT ecosystem continued to grow. The total number of daily new NFTs on the network grew by 19.3% between July and September, exceeding eight million.

Interestingly, while the total number of daily new NFTs on Solana grew in Q3, secondary sales volume on the network fell by 62%. As regards the cause of this, Messari found that,
“Macro forces may have stalled the secondary market during Q3, as unique sellers outpaced buyers. For perspective, Q2’s secondary sales volume spiked and was largely supported by the rapid success of Magic Eden, OpenSea’s integration with Solana, and the adoption of Metaplex’s Collection Standard.”
There were some declines
As for declines on the network in Q3, the report showed that user activity, measured by Unique Fee Payers and Unique Signers, dropped on Solana.
Average Unique Fee Payers on Solana within the 90-day period totaled 223,015. This represented a 31.4% decline from the 324,943 recorded in Q2.
As regards revenue on the network, this dropped by 25% in Q3 as average transaction fees also fell by 42% within the same period.
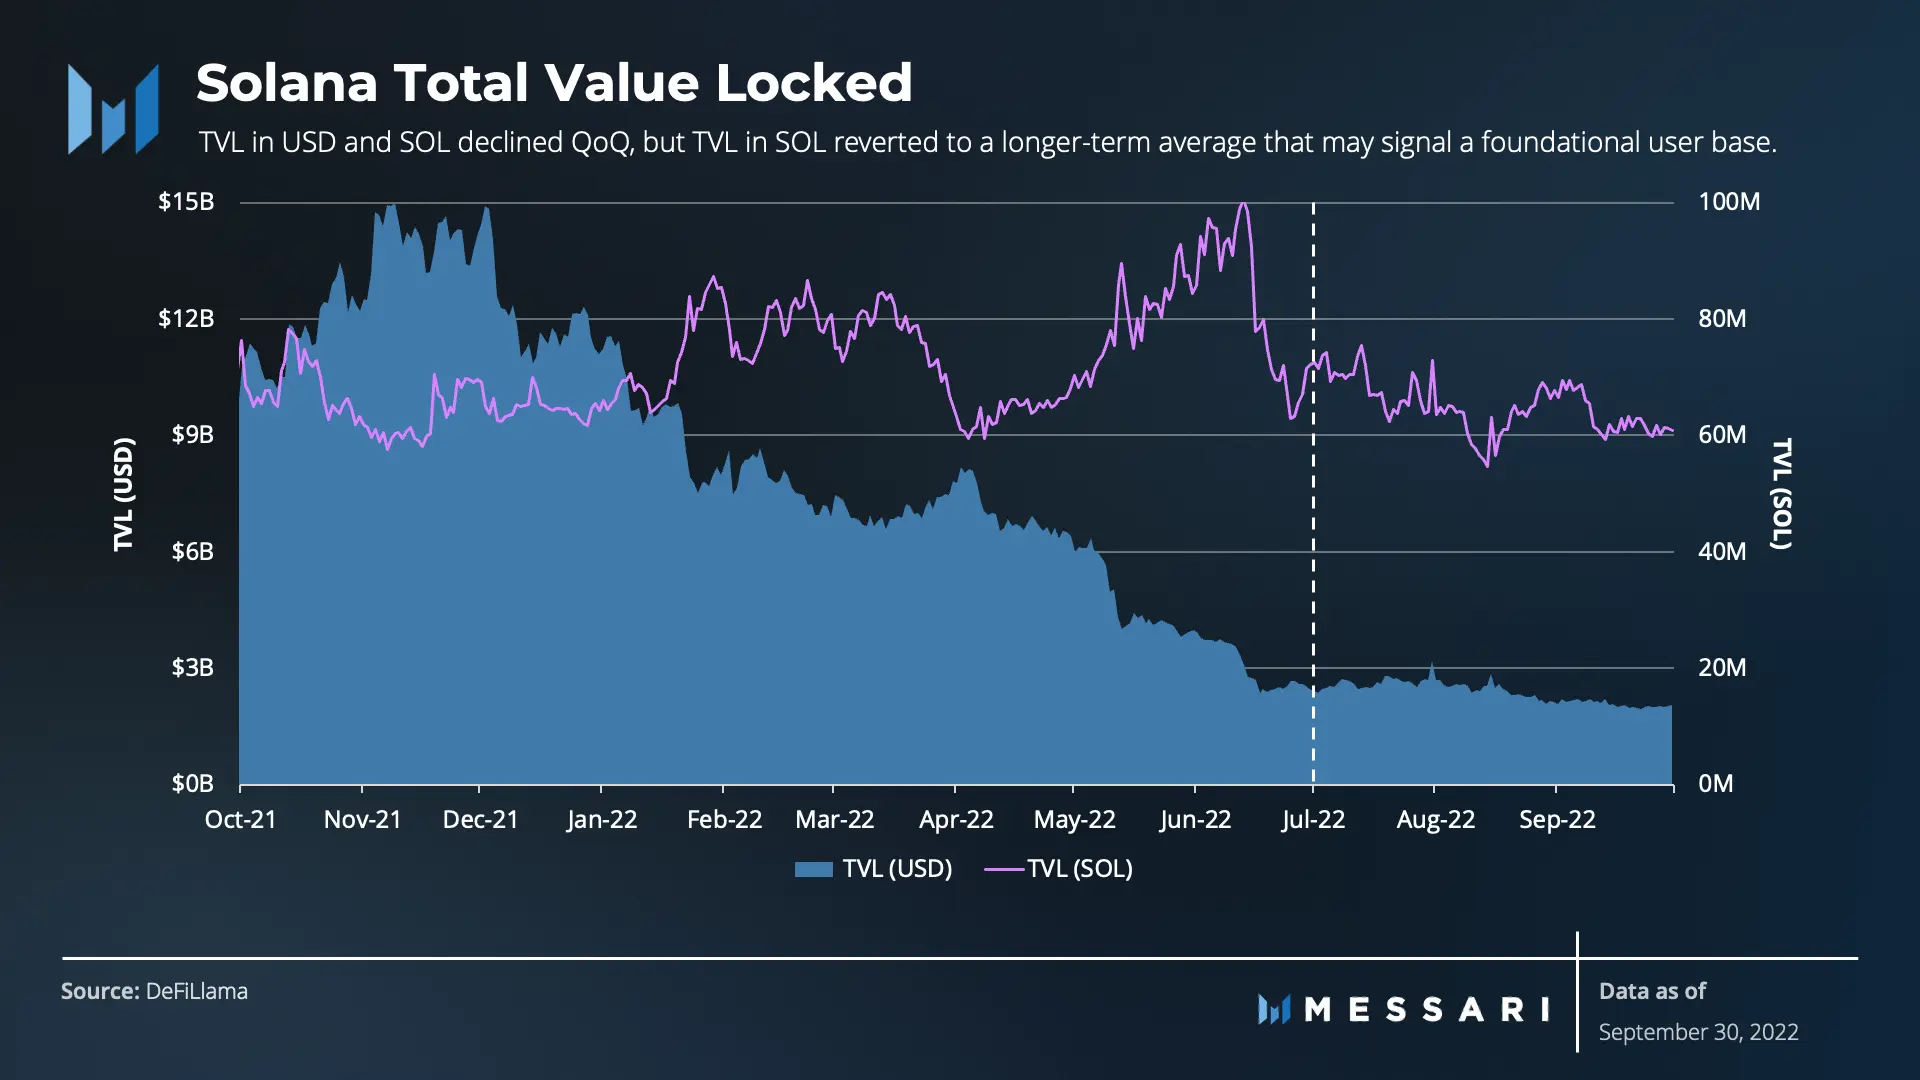
Further, like other Layer 1 networks, the total value locked (TVL) by decentralized finance (DeFi) protocols on Solana fell by 16% in Q3. Although there was a drop in TVL, Messari opined,
“Nonetheless, a healthy distribution of TVL across applications still exists on Solana. Currently, 50% of TVL is locked across most of the long-tail DeFi protocols on the network. The continued level of diversified TVL helps mitigate overall ecosystem risk. Some top networks by TVL have exposure to single applications with anywhere from 50-60% of the ecosystem’s TVL. In contrast, no single Solana application appears “too big to fail,” with Solana’s largest DeFi protocol, Solend, capturing only 14% of TVL at the end of Q3.”