Solana [SOL]: Before you go short, watch out for these factors

Disclaimer: The information presented does not constitute financial, investment, trading, or other types of advice and is solely the opinion of the writer.
Bitcoin [BTC] faced intense selling pressure and fell to the $20.8k mark as it experienced a 26% drop in under two days. Ethereum [ETH] fared worse and recorded losses of around 30% in the same time period. Solana [SOL] was also in the grip of the bears, and its structure on the price charts suggested that another drop could be around the corner. If the bulls can reclaim $32, some respite could be seen, but the more likely outcome remains further losses for Solana.
SOL- 4H
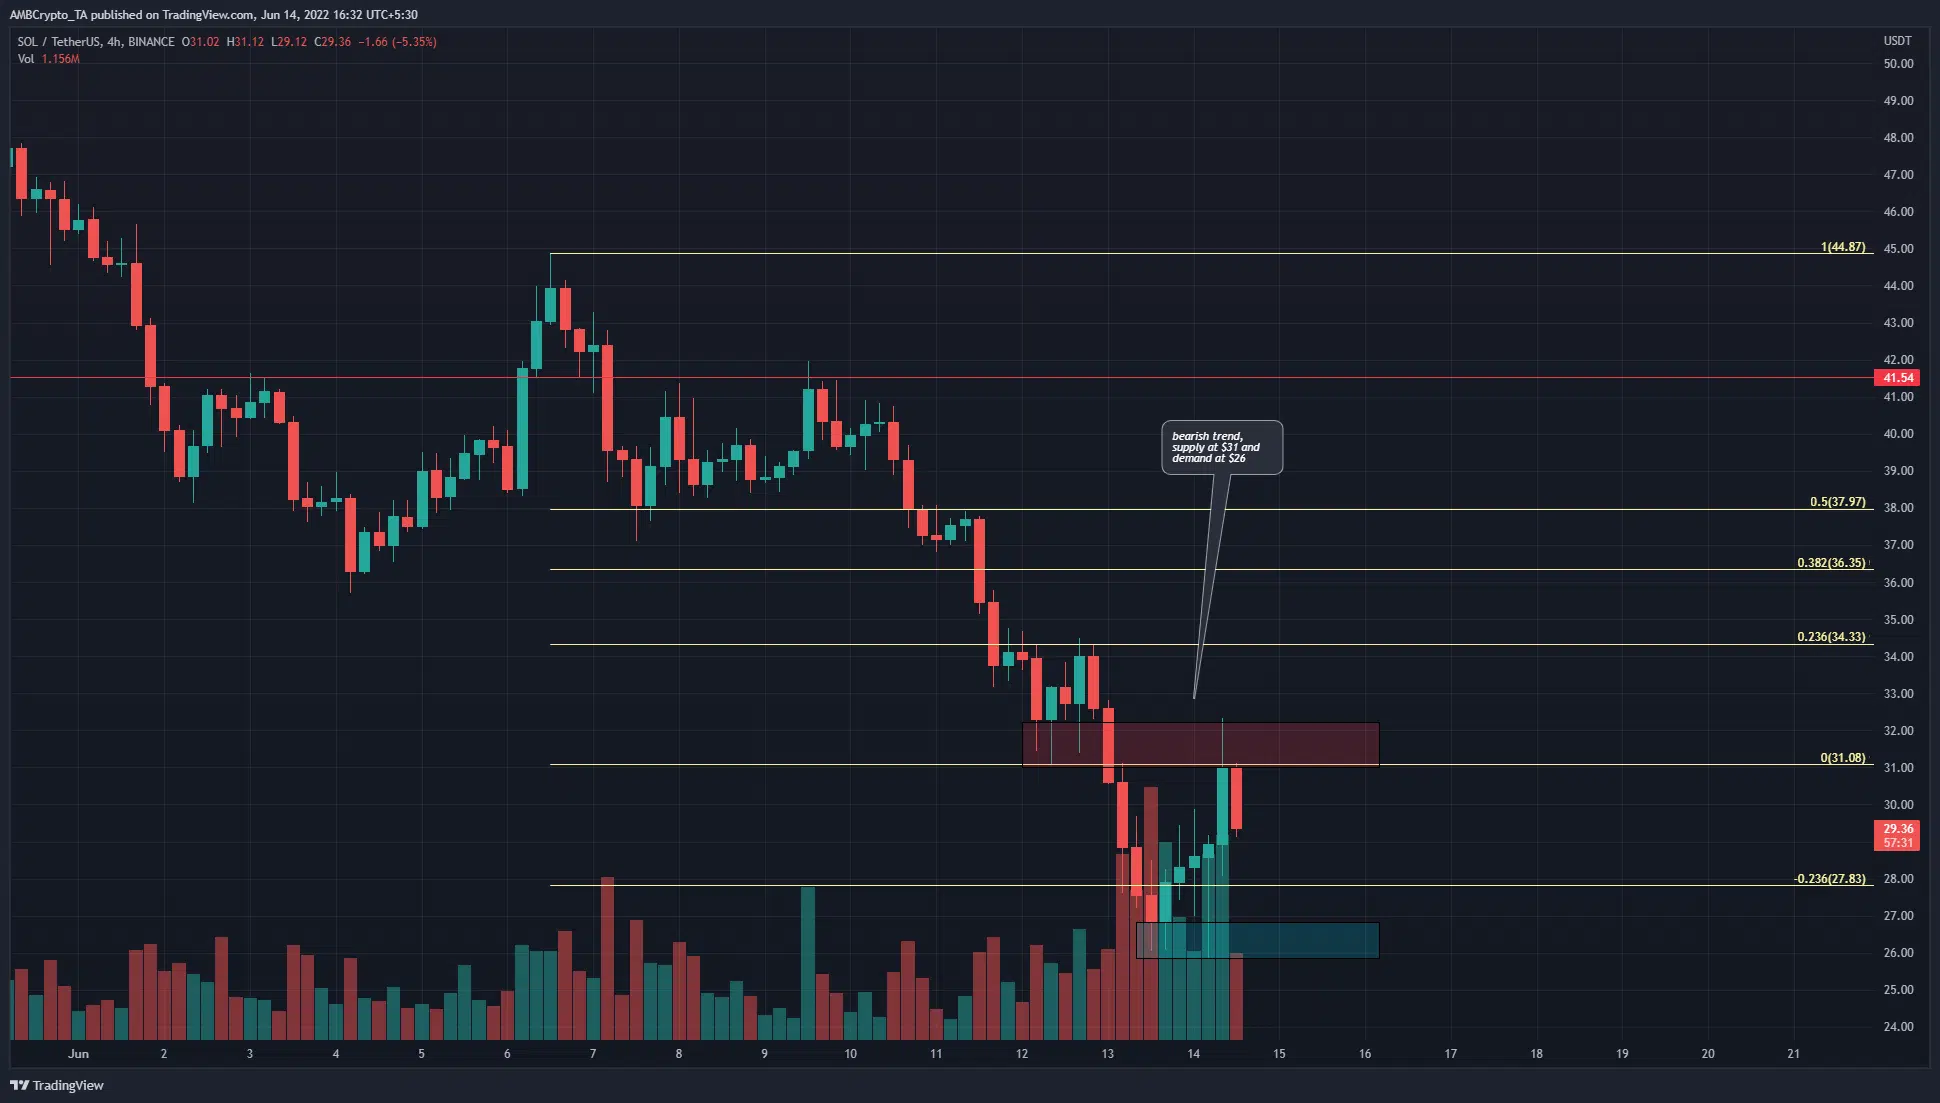
The H4 market structure showed a strong bearish bias. Since April, the trend has been sharply downward, although SOL was able to hold on to the $41 support level throughout May. In June, however, the price slipped beneath this level and has since retested the $45 area as a supply zone, and confirmed $41 as resistance, before falling swiftly in the past week.
The $32 area (red box) has also been retested as a supply zone, while the $26-$27 area has been retested as a demand zone (cyan box). The Fibonacci extension levels showed that $27.8 could act as temporary support on the way south.
SOL- 1H
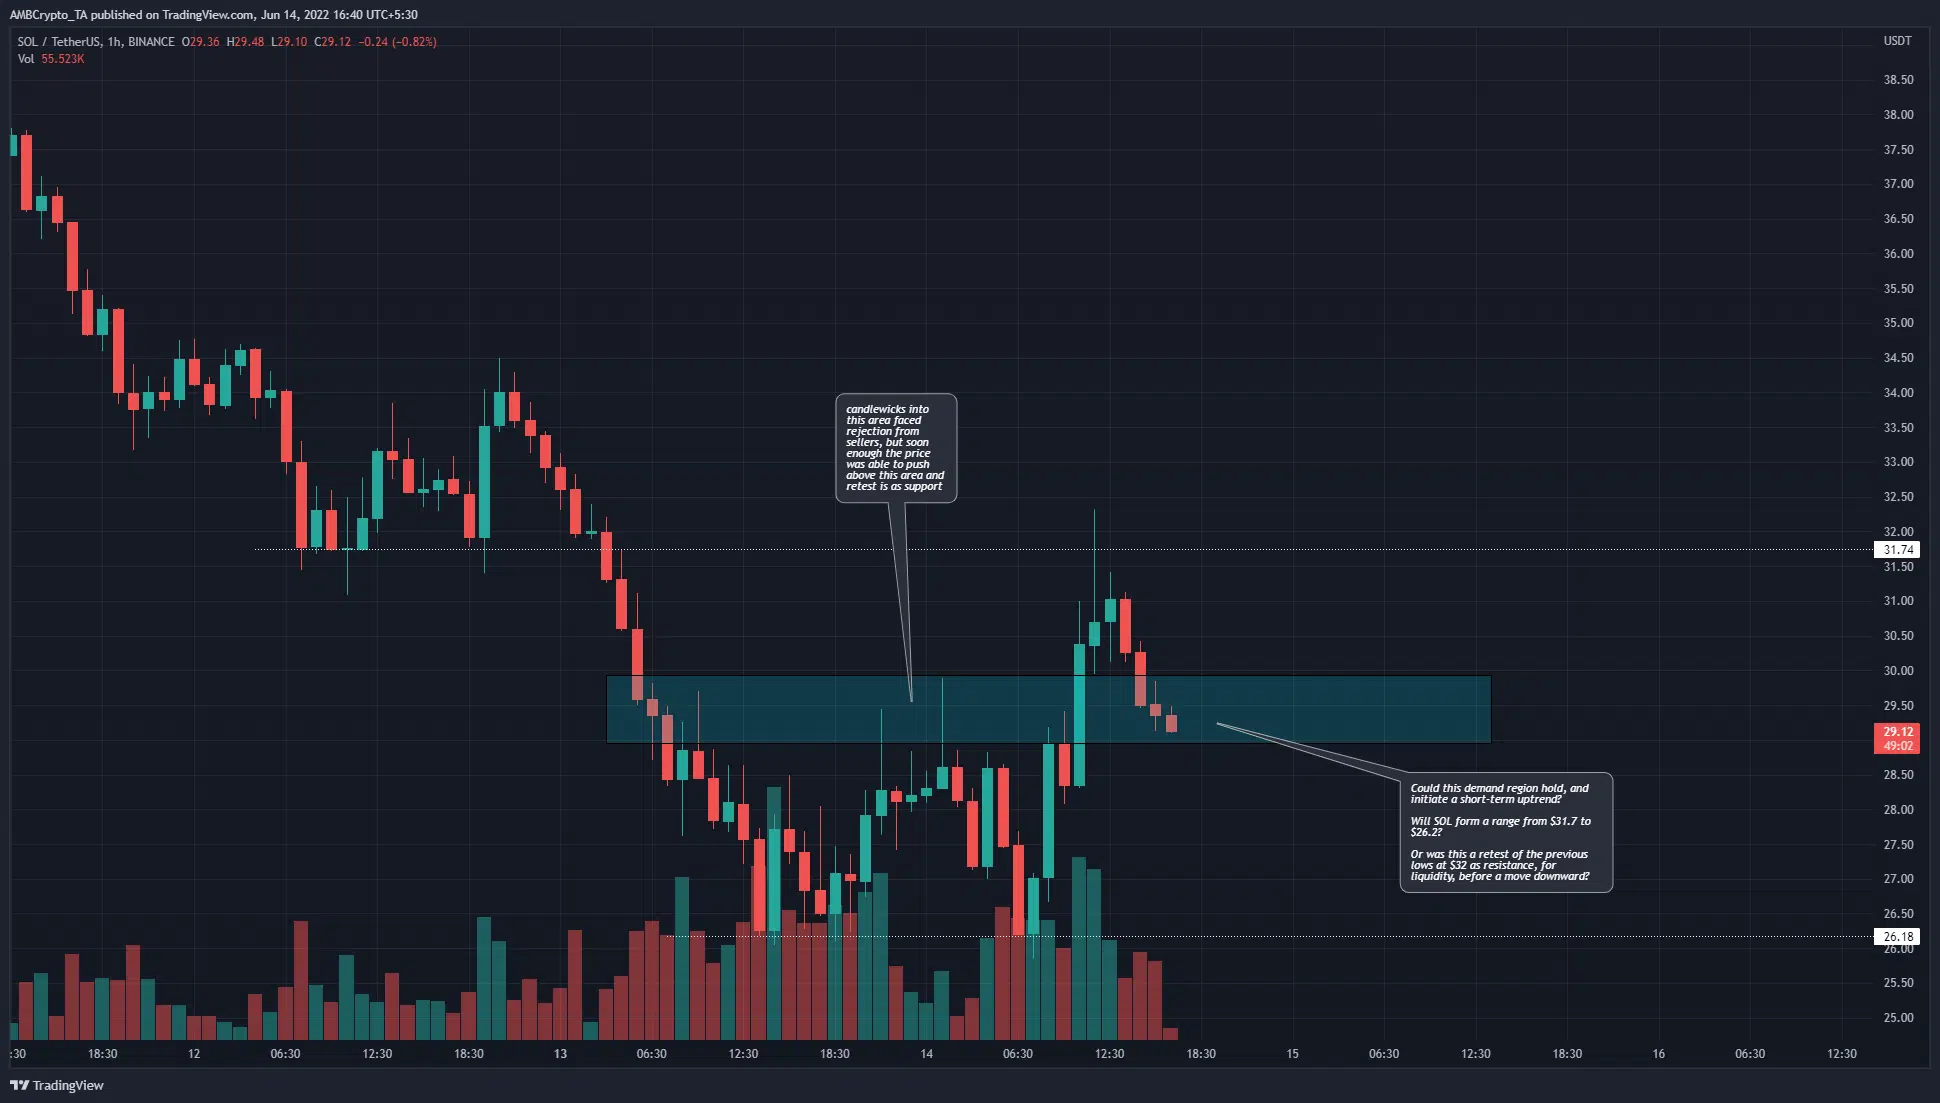
The hourly chart was slightly more complicated. The trend was still bearish, but the lower timeframe market structure was broken because of the push to $32.3 in the past few hours of trading. In dotted white are two levels that could see SOL establish a range within, with the $29.5 area being a temporary demand zone.
However, despite this short-term bullish break, the larger timeframe structure remained bearish. Therefore, it was likely that SOL would head back toward the $26 mark, and possibly even lower.
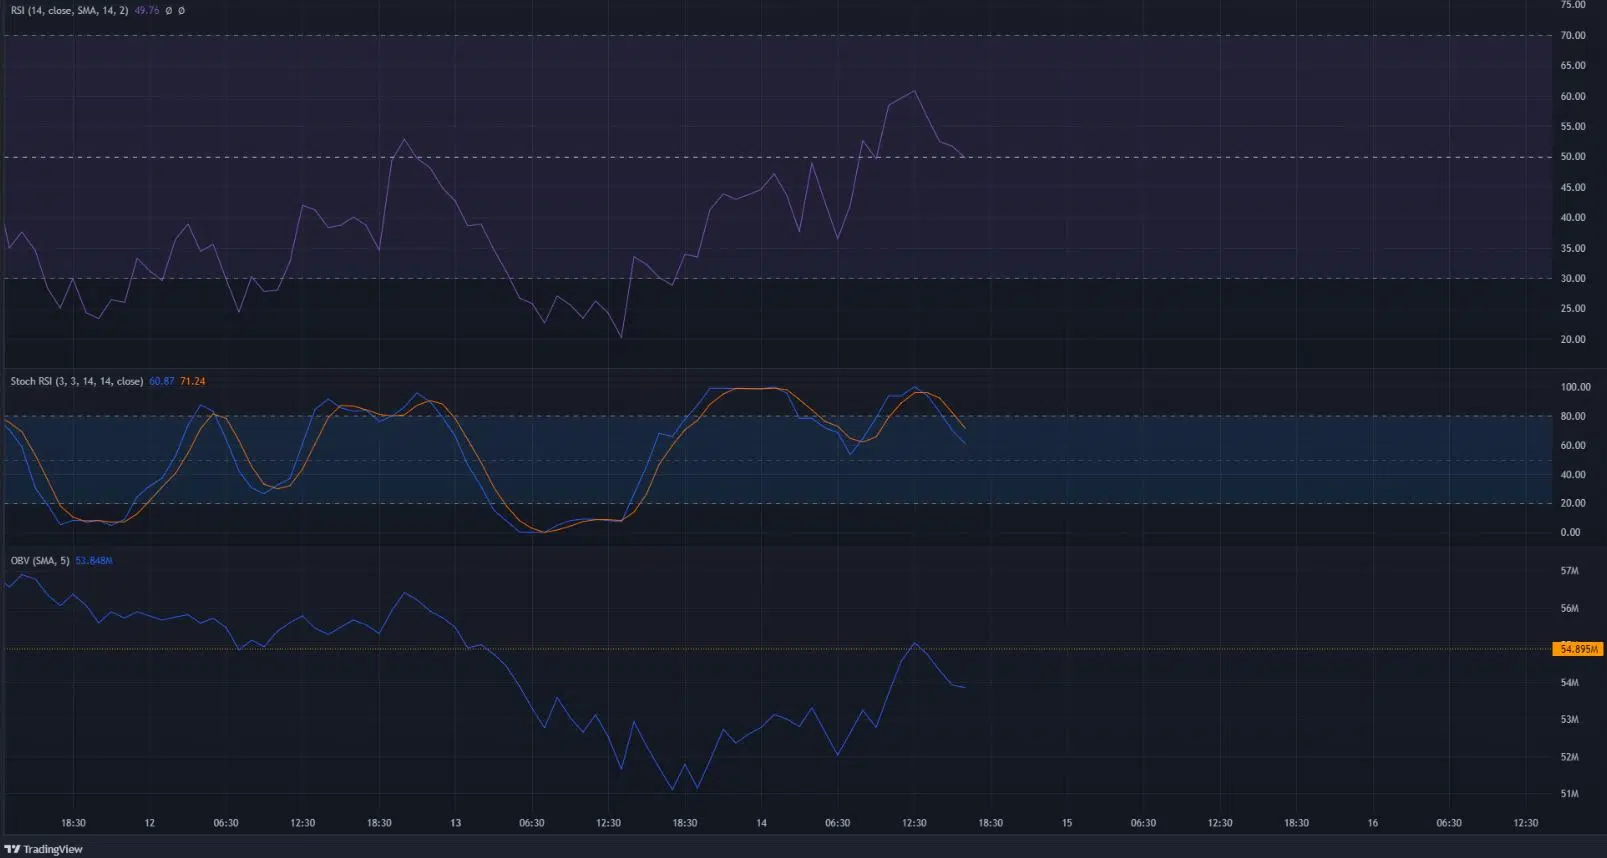
The Relative Strength Index (RSI) stood at 49.7, but if the bulls can defend the $29 zone, SOL might still be able to push toward $32 once again. However, a session close below the cyan box would likely see SOL drop toward $26.
The Stochastic RSI formed a bearish crossover in overbought territory and was headed lower, while the OBV faced resistance at a level that was supported just a few days ago. The selling pressure could force the OBV to drop yet again.
Conclusion
An hourly trading session close beneath $29 could offer an opportunity to enter a scalp short position, with a stop-loss just above $30 and take-profit at $26.2. However, if the bulls can defend the $29 area, a revisit to the $32 area could offer shorting opportunities.


