Solana [SOL]: Everything about the bullish signal hinting at a 42% rally

Solana’s price has been coiling up between two significant barriers, indicating a drain in volatility for the altcoin. As a result, the daily returns for SOL have been stuck below 6% for roughly two weeks with no signs of a breakout.
However, the latest movement of the two barriers signals that a bullish explosion in SOL’s price is likely. Therefore, investors need to pay close attention to how SOL reacts to a stiff resistance barrier. In doing so, they should position themselves accordingly to book massive profits.
Solana readies for an exponential move
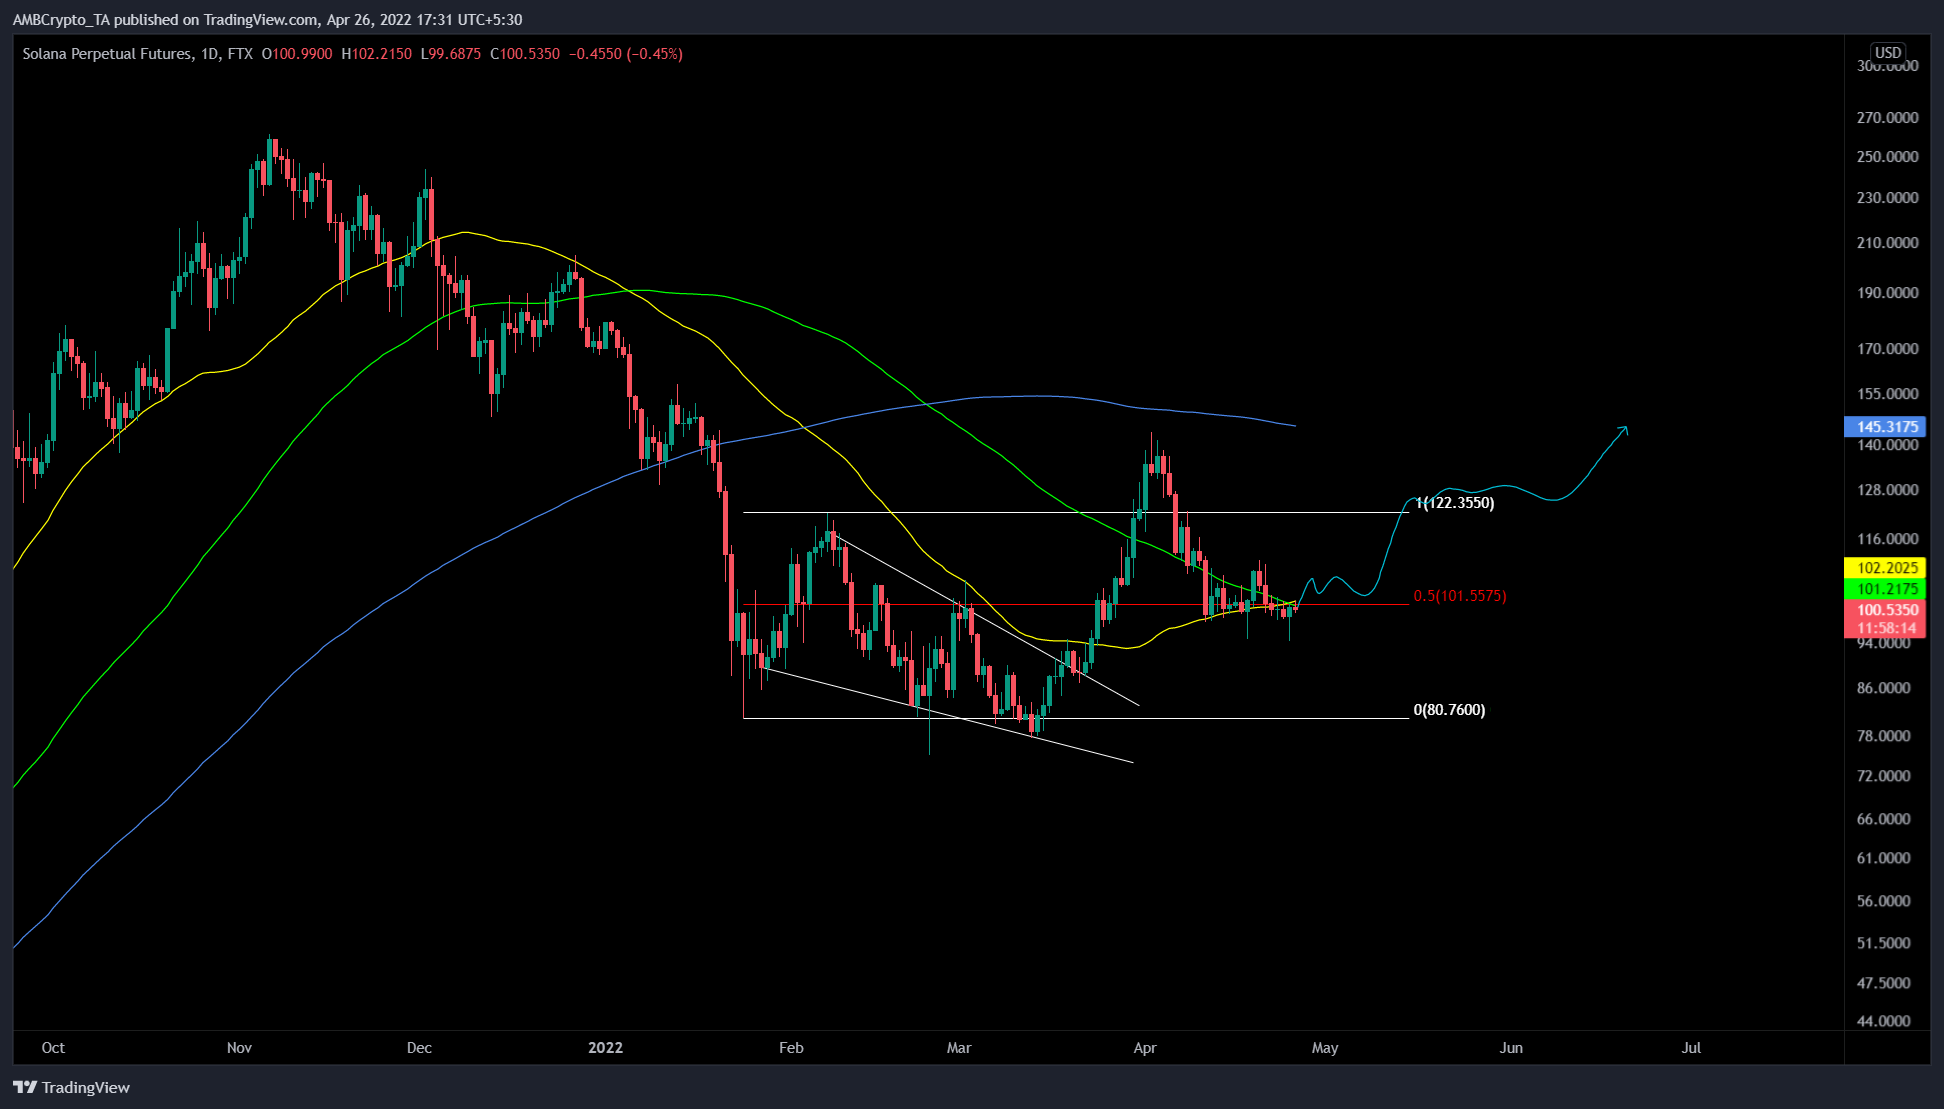
Solana’s price created a range between $80.76 to $121.52 after climbing by roughly 50% between 24 January and 7 February. These two levels served as a boundary that SOL bulls and bears respected over the past three months.
As described in previous articles, when an asset slips into a range, the moves are often simple to anticipate and therefore, trade. More often than not, the asset drives lower to sweep one of the limits of the range, followed by a move to the other side.
Interestingly, SOL stuck to this thesis and swept the range low at $80.76 on 24 February. Also, it rallied by 91% over the next month or so to deviate above the range high at $122.64 and set a swing high of $143.64.
While this move is impressive, the big crypto fumbled, causing altcoins including Solana to come crumbling down. Couple this bearish market structure with retail FOMO, SOL’s price crashed 32% and shattered the range’s midpoint at $101.70 on 11 April.
Since then, SOL has been moving sideways between the 50-day Simple Moving Average (SMA) and the 100-day SMA. Interestingly, these two SMAs converged together during this coiling up, leading to a bullish crossover as of 25 April.
This technical formation involves the faster moving average climbing above the slow moving average. It is a sign that short-term bullish momentum is rising faster than long-term bullish momentum.
However, Solana’s price needs to make range’s midpoint at $104 into a foothold to trigger a 42% rally. One that retests the 200-day SMA at $145.
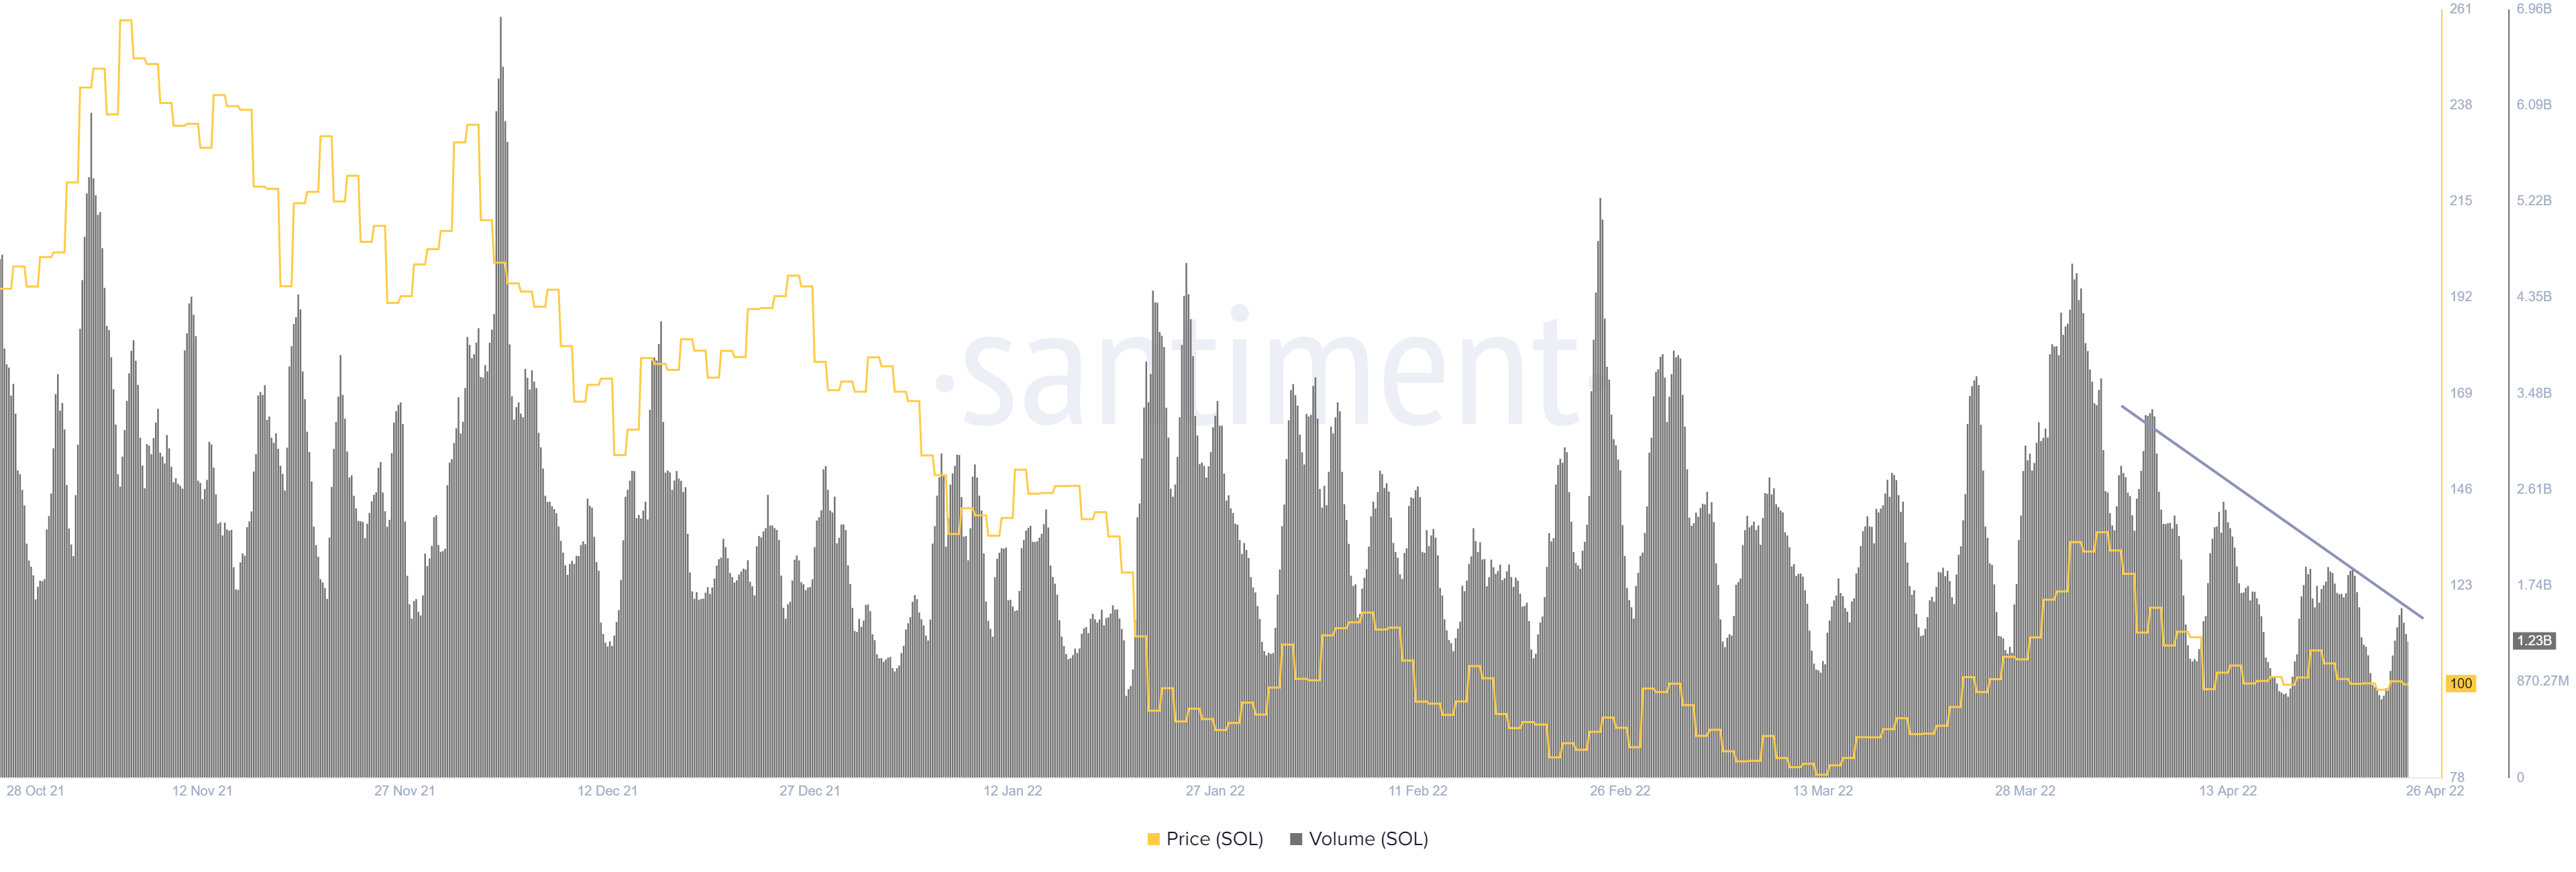
Supporting this massive upswing for SOL is the on-chain volume. It has been on a downtrend since 7 April. This reduction from 3.26 billion to 1.21 billion in on-chain volume is important. These are often viewed as a requirement during consolidative phases. Especially since they results in explosive breakouts.