Solana [SOL] might see an extended decline unless the bulls…

Disclaimer: The findings of the following analysis are the sole opinions of the writer and should not be considered investment advice
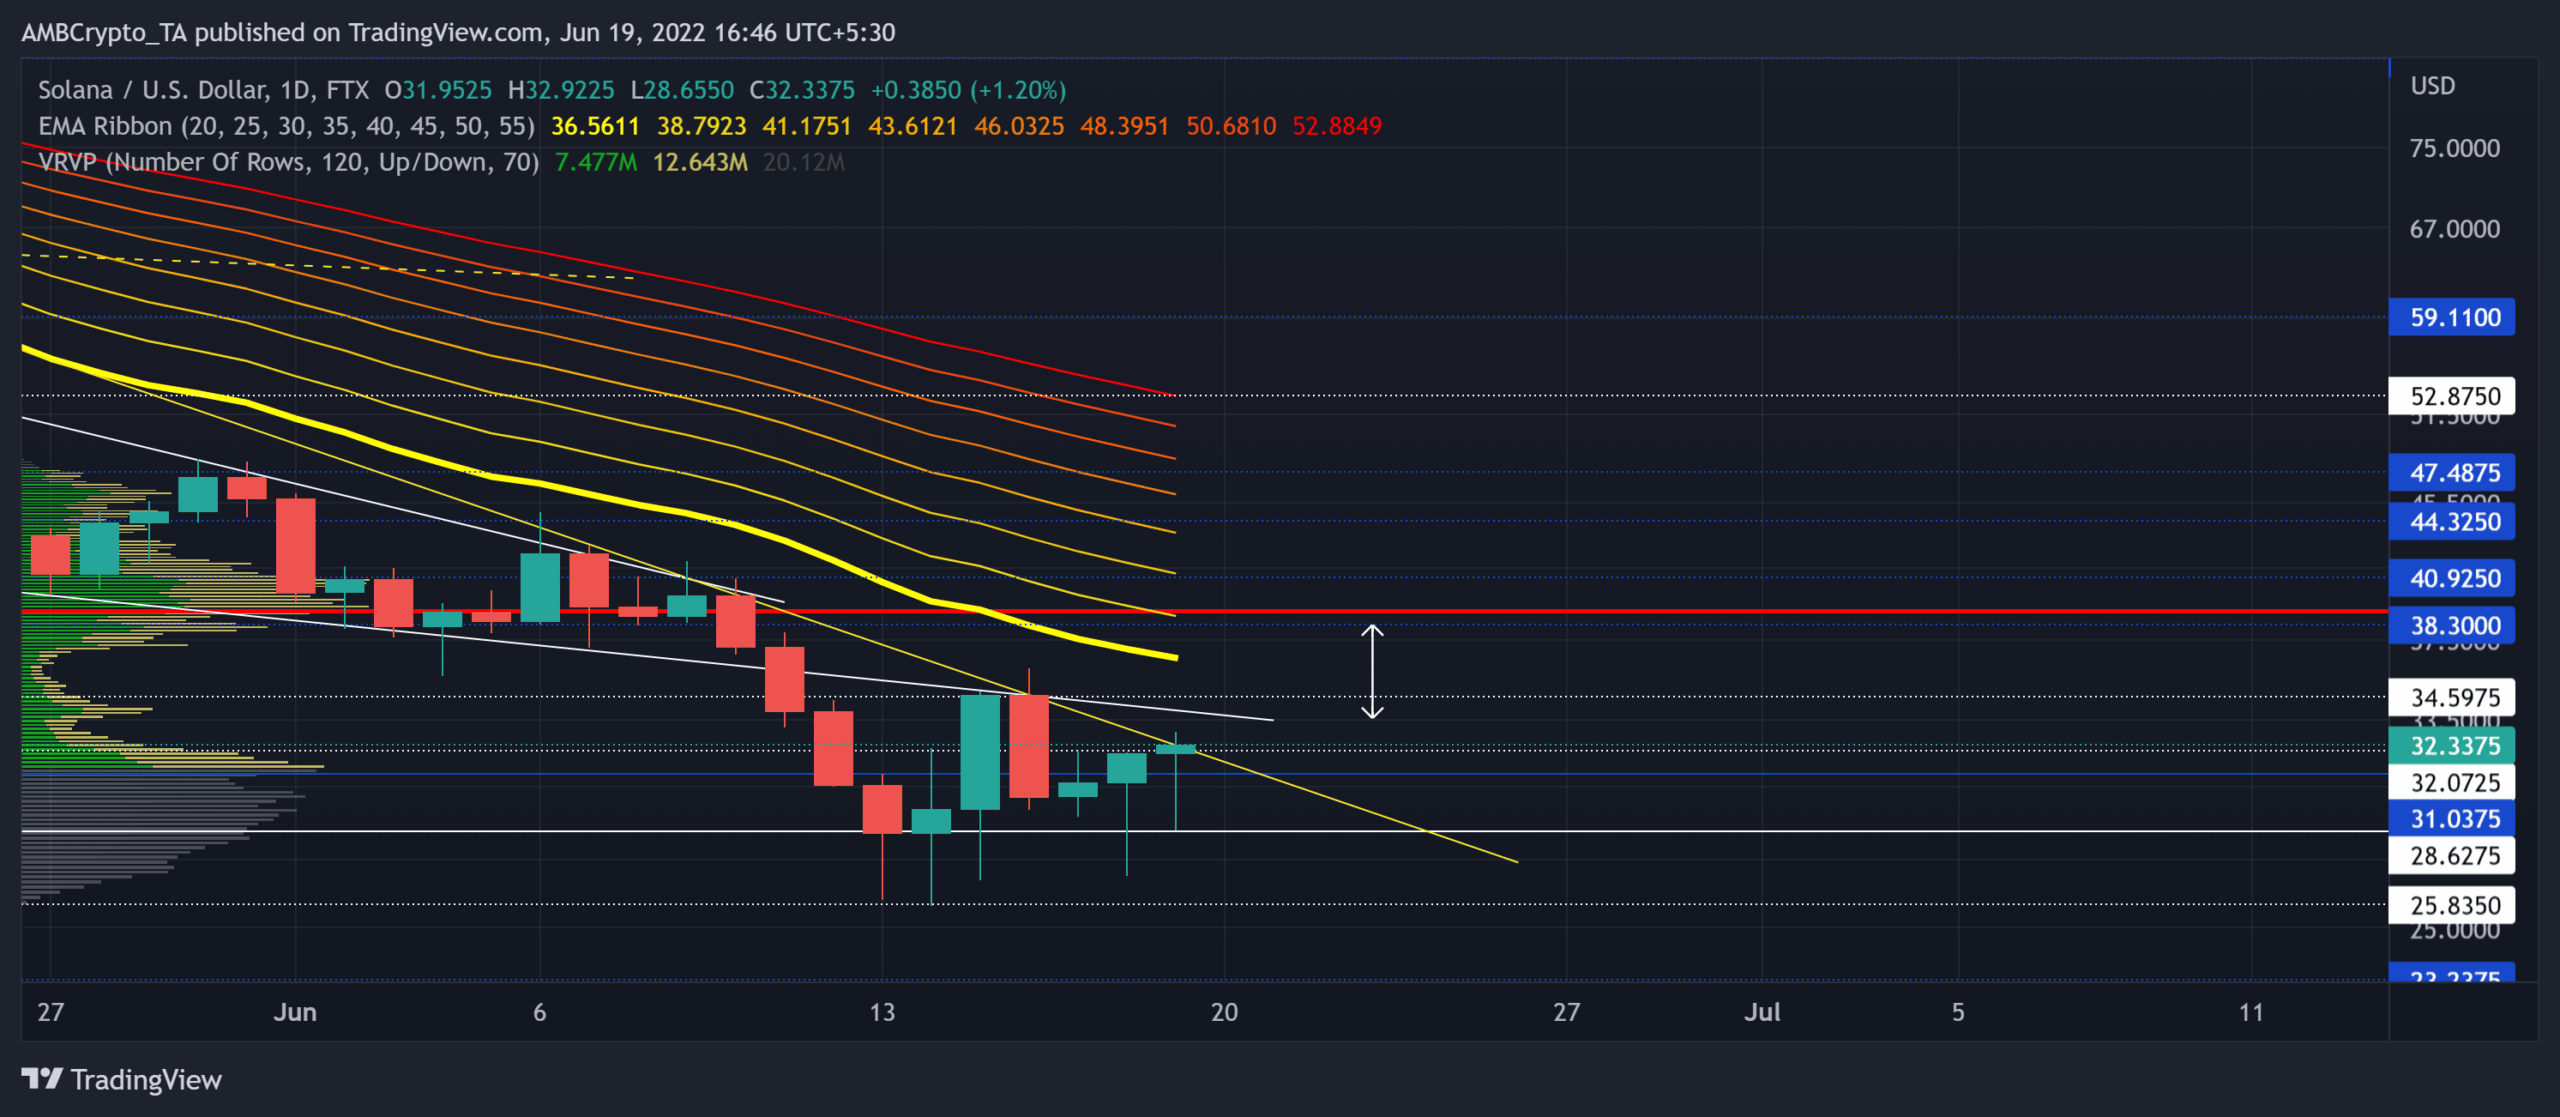
Solana’s [SOL] recent movements corresponded to the fear sentiment as it dipped below its south-looking EMA ribbons. While the altcoin invalidated the bullish tendencies and broke down from its falling wedge, the $28-mark support has provided immediate grounds.
A close above the six-week trendline resistance could open up short-term recovery opportunities, provided the bulls continue to boost the buying volumes. At press time, SOL traded at $32.3375, up by 8.42% in the last 24 hours.
SOL Daily Chart
SOL’s decline from the $85-mark made way for a bear run that accounted for a 72.7% 40-day decline (from 6 May). Consequently, it gravitated to touch its 11-month low on 14 June.
As the selling pressure intensified, the alt refrained from inflicting a northbound breakout from its month-long falling wedge (white).
The bounceback from the $28-support provoked a bullish hammer in the daily timeframe. This candlestick could give the bulls much-needed hope to break above the $32-$34 range resistance.
Should the current candle close as green, the buying strength would reaffirm the potential effectiveness of this hammer. Also, SOL registered a nearly 51% spike in 24-hour volumes alongside the daily gains.
A compelling close above the six-week trendline resistance (yellow) could place the alt in a position to test the Point of Control (POC, red) in the $39-zone.
As the wider market stood conducive for the sellers, the EMA’s south-looking trend would likely halt the near-term buying efforts.
Rationale
The RSI, at press time, was on a slight uptrend but hit the 39-ceiling while the sellers still claimed an edge. Also, over the last four days, the OBV’s higher peaks saw a bearish divergence with the price. This reading entailed a potential short-term slowdown in the coming sessions.
Furthermore, the DMI lines visibly revealed a bearish edge. Until the gap between these lines registers significant improvements, investors/traders could avoid placing calls.
Conclusion
SOL’s recent bullish hammer alongside the uptick in buying volumes can propel a short-term recovery. But for that, bulls need to topple the $32-$34 range.
While the indicators suggested a bearish edge, SOL could likely continue on its south-looking trend in the coming days. Finally, keeping an eye on Bitcoin’s movement would be vital in making informed calls.


