Solana [SOL] retests former range lows: Are further gains unlikely?
![Solana [SOL] retests former range lows: Are further gains unlikely?](https://ambcrypto.com/wp-content/uploads/2023/01/PP-1-SOL-cover-1-e1672715930357.jpg)
Disclaimer: The information presented does not constitute financial, investment, trading, or other types of advice and is solely the writer’s opinion
- Short-term market structure and momentum were strongly bullish at press time.
- The spot CVD has declined, which meant that sellers have the upper hand.
Solana [SOL] sellers have been dominant since mid-December. They forced a drop of close to 42% in two weeks, dropping from $15 to $8.8. Meanwhile, Bitcoin [BTC] meandered around the $16.6k level, unable to make up its mind.
Are your SOL holdings flashing green? Check the Profit Calculator
Short Solana positions have been squeezed with a vengeance in recent days, and more bears could be trapped in the coming days. Even though SOL lacked significant demand, it was risky to short the asset.
The lows of the former range were retested- and another surge upward cannot be discounted
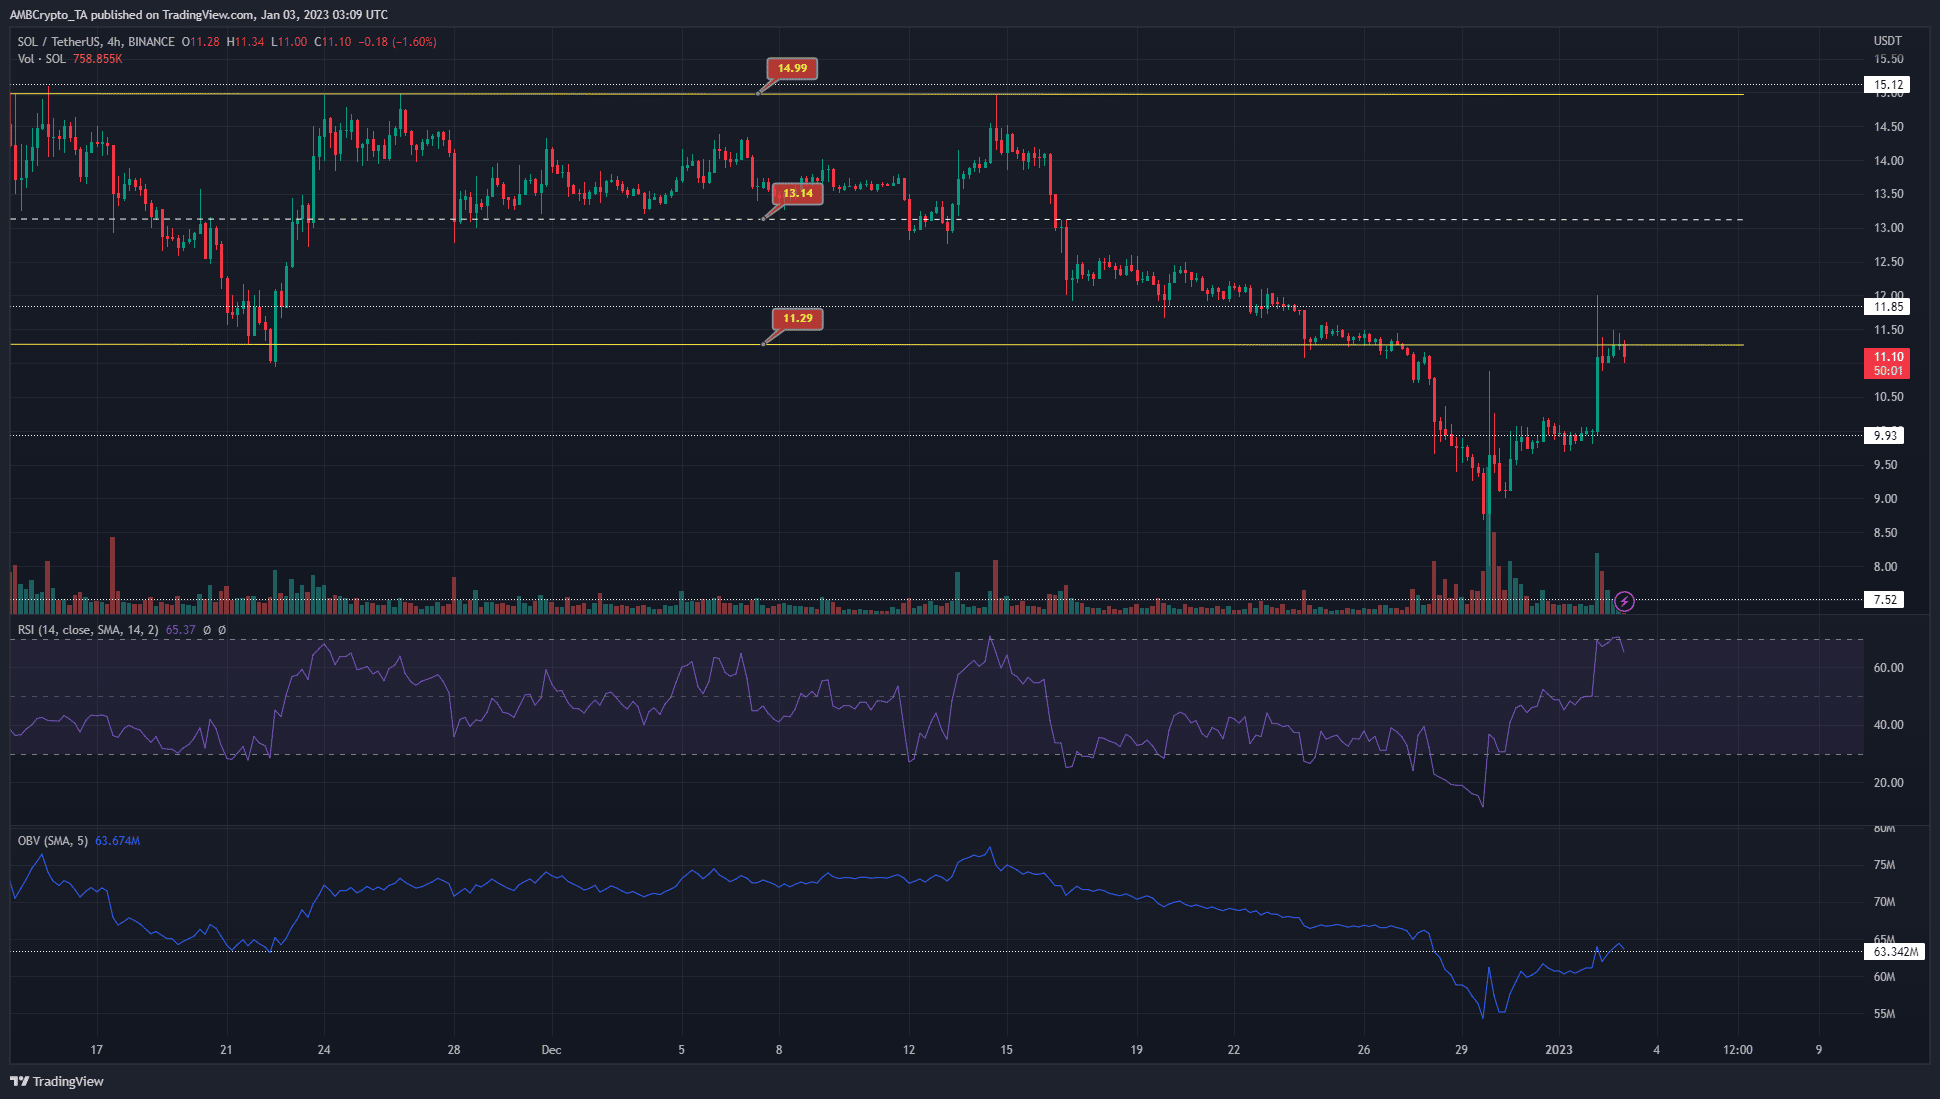
From 22 November to 27 December, Solana traded between $11.3 to $15. It also had a level of support at $9.93. In late December, intense selling pressure saw SOL drop to $8. However, this dive was followed by a large short squeeze.
After the $9.93 level was flipped to support, SOL saw yet another upward spike, which carried the prices to the former range lows in recent hours of trading. The Relative Strength Index (RSI) showed strong bullish momentum over the past few days. The move above the $10.78 – $11.12 region indicated that Solana could climb even higher.
The On-Balance Volume (OBV) made gains in the past three days, but it faced resistance nearby, similar to how the price faced resistance at the $11.3 mark. A move upward for both the OBV and the price could see another push higher toward the mid-range mark at $13.15.
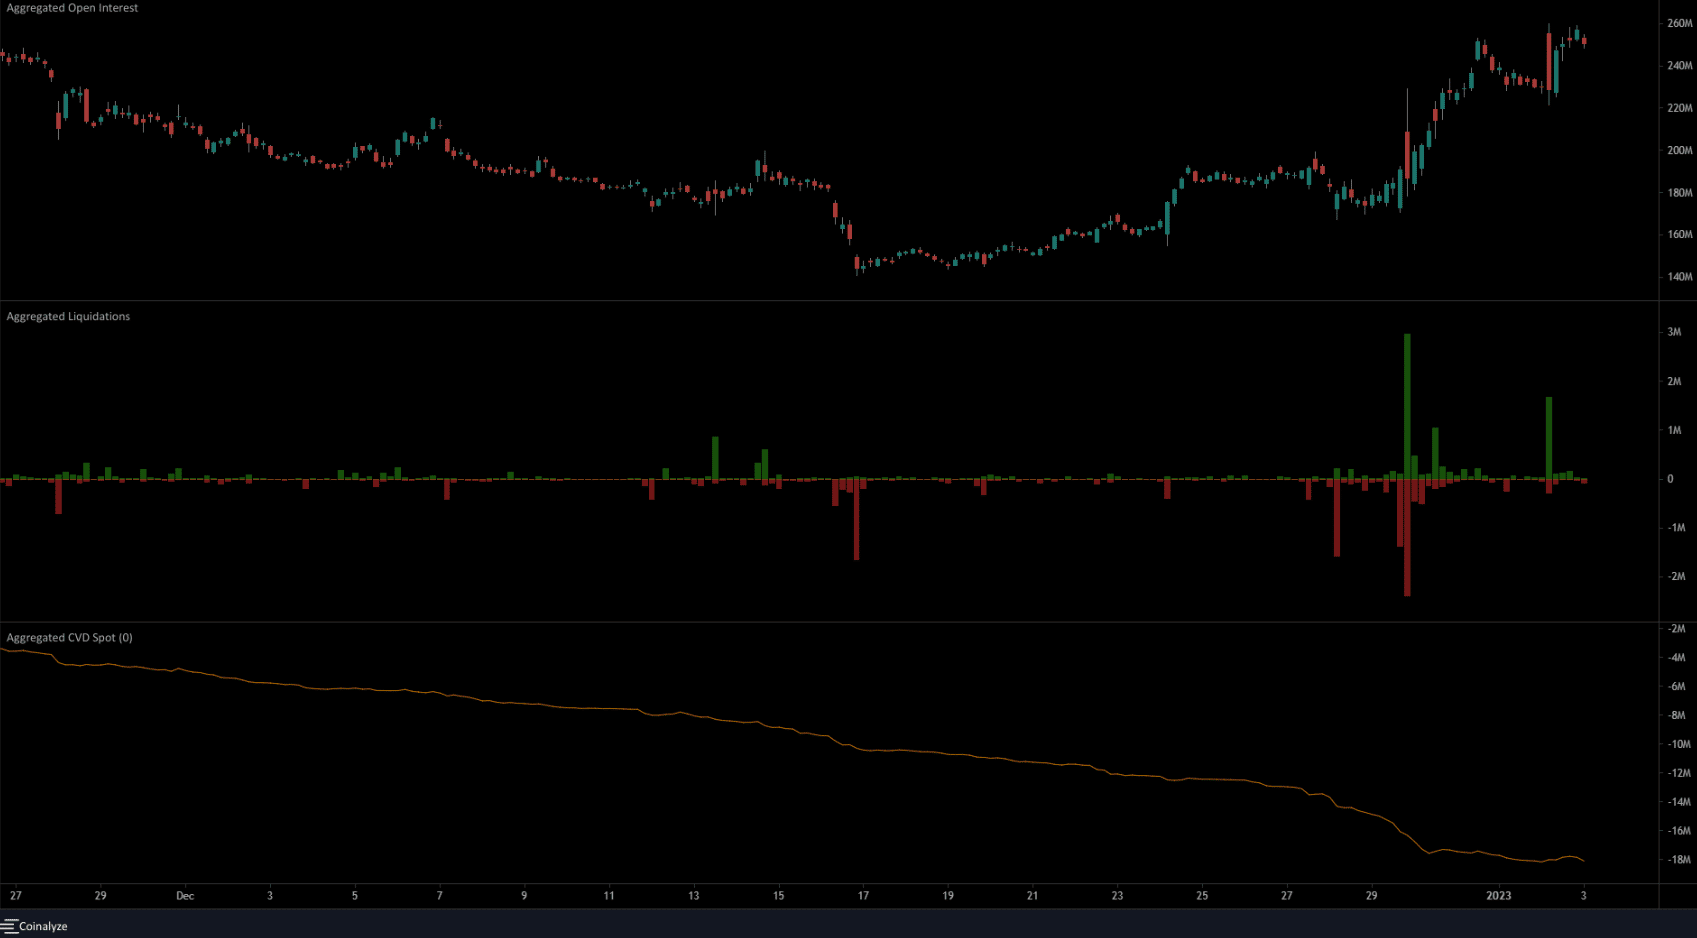
Despite the increase in OI, CVD remains unconvincing
How many SOLs can you get for $1?
The spot CVD did not inspire bullish confidence. The negatively sloping CVD meant that sellers were dominant throughout December. This shifted to a more neutral stance in recent days, but the CVD continued to see a downward slope. The liquidation chart highlighted that a large number of short positions had been liquidated already.
The market structure was bullish on lower timeframes, and the Open Interest was also increasing. With the CVD showing a lack of demand, the inference was that a strong higher timeframe uptrend was unlikely to be established. However, that does not rule out another move upward to $13, or even higher, to liquidate more short positions.