Solana [SOL] traders can see barriers in $47-$50 range if…

Over the last few weeks, Solana’s [SOL] patterned breakout crystallized into a symmetrical triangle after retesting the upper trendline of the down-channel.
The close above the 20 EMA (red) and the 50 EMA (cyan) has hinted at an increasing buying edge. But the alt was yet to find a volatile break to confirm a change in its long-term trend.
The gradual uptick in SOL’s troughs could improve its chances of snapping the 61.8% Fibonacci resistance. However, the bulls must continue to ramp up the buying volumes to topple the supply zone (red, rectangle).
At press time, SOL was trading at $44.18.0, up by 10.55% in the last 24 hours.
SOL Daily Chart

SOL corroborated with the improvement in the broader market sentiment by registering gains after picking itself up from the $28 baseline.
The gradual buying resurgence aided the bulls in undermining the long-term down-channel.
The subsequent breakout rally transposed into a symmetrical triangle in the daily chart over the last three weeks. Meanwhile, the price kept drifting along the 20 EMA (red) and the 50 EMA (cyan) while making itself more prone to a volatile break. Traders/ investors should look for a potential bullish crossover on these EMAs to identify the chances of a sustained recovery beyond the $46.5 zone.
A rebound from this level could extend the sluggish recovery phase in the coming sessions. In this case, SOL would fall back to retest the Point of Control (POC, red) near the $39-level.
Owing to the previous uptrend, the symmetrical triangle breakout exhibited bullishness. A plausible close beyond the 61.8% level could see barriers in the $47-$50 range.
Rationale
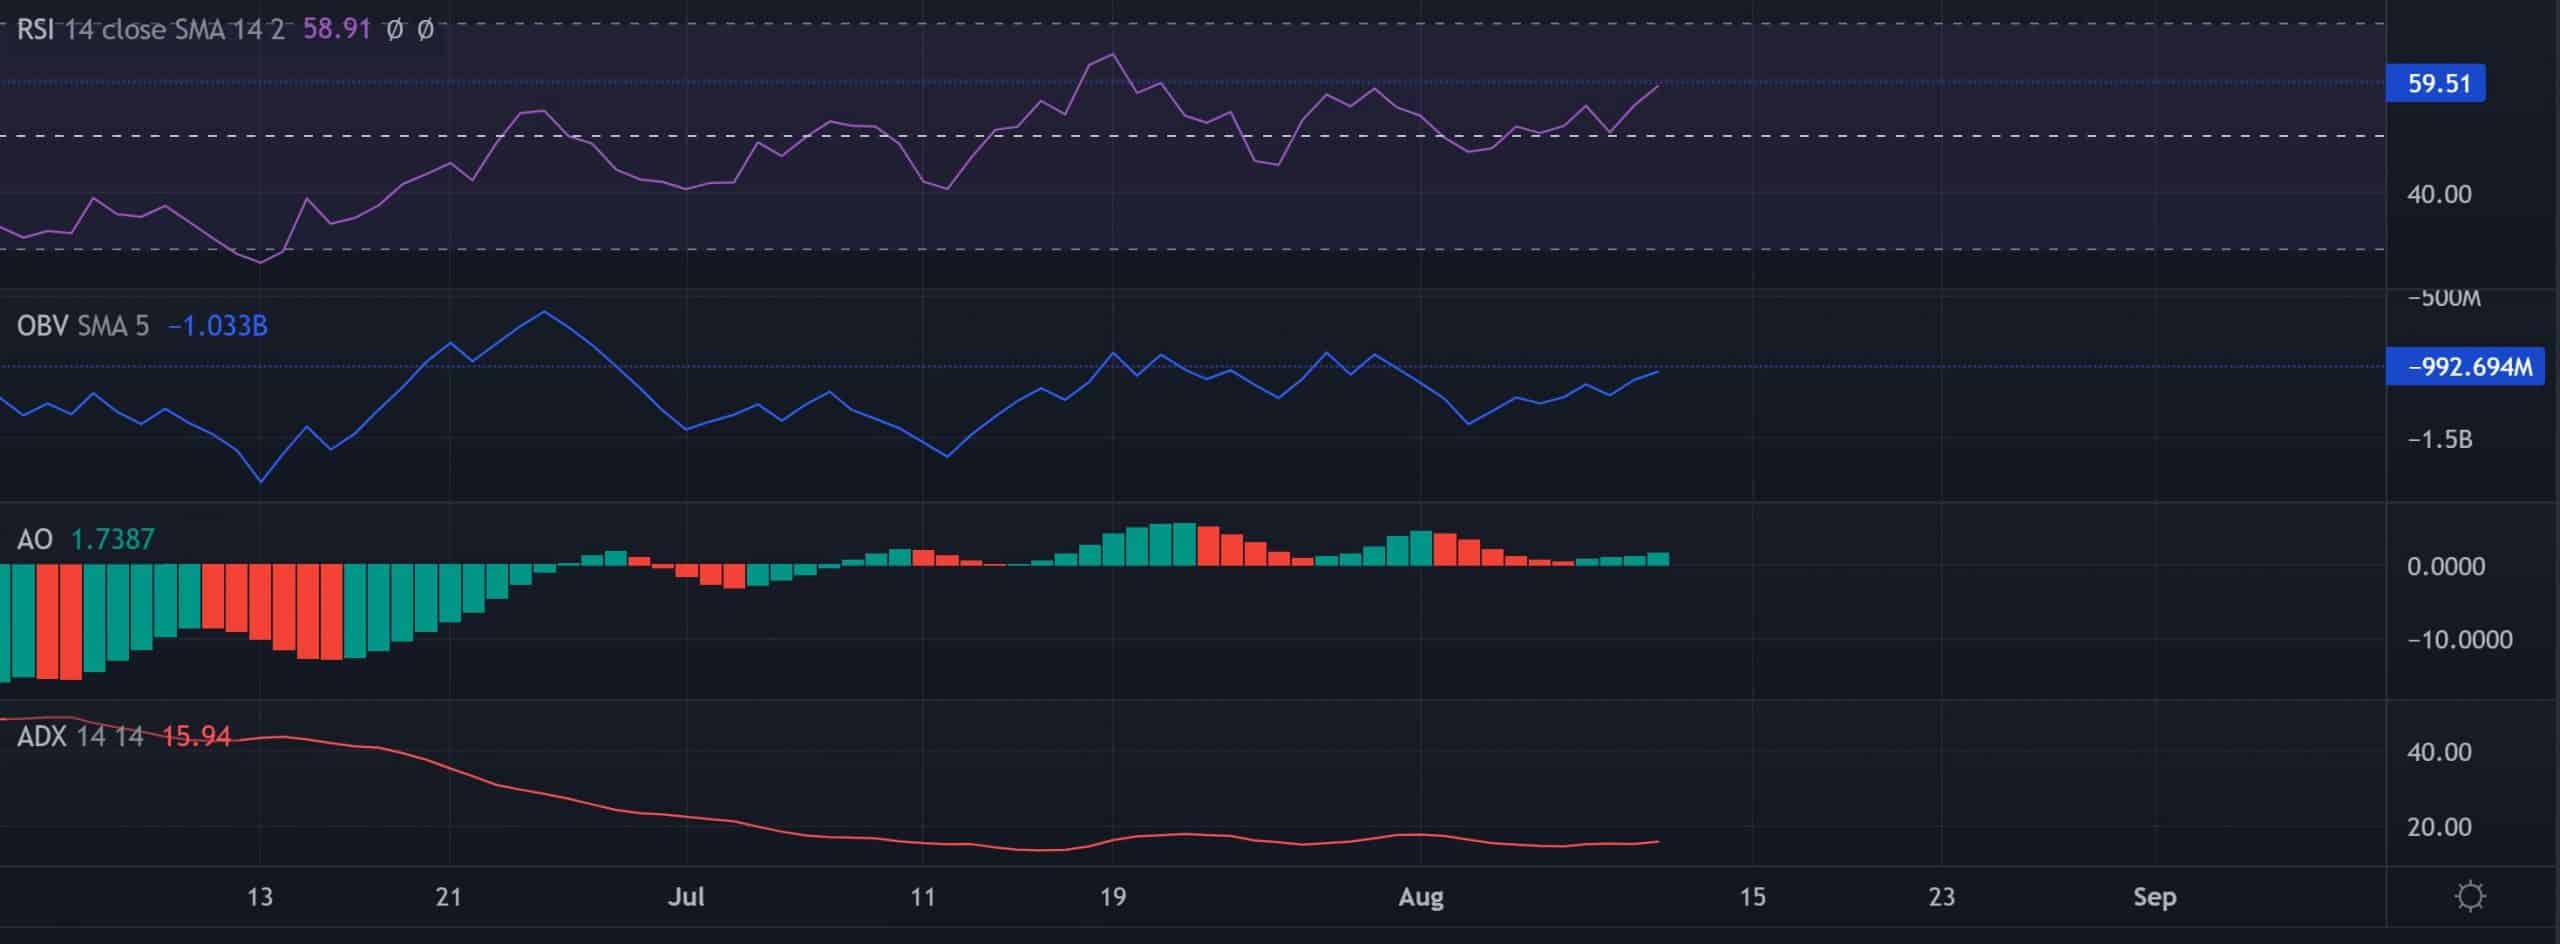
After finding a reliable position above the midline, the RSI has depicted a slight edge for the buying momentum. An inability to close beyond the 59-60 resistance range can help sellers curtail the increasing buying pressure.
The OBV reflected a slight uptick over the last week but was yet to topple its immediate resistance. Also, should the price see a sudden uptick, its peaks would confirm a bearish divergence with the OBV.
Further, the AO marked lower peaks and approached its equilibrium. This trajectory revealed a decreasing buying edge. Nevertheless, the ADX continued to display a substantially weak directional trend for SOL.
Conclusion
Given the symmetrical triangle breakout, SOL could see a continued revival that may encounter a hurdle in the supply zone. A bullish crossover on the EMAs and an uptick in volumes could invalidate the bearish tendencies. The triggers and take-profit levels would remain the same as above.
Finally, investors/traders must keep a close eye on Bitcoin’s movement to determine its effects on the broader sentiment.