Solana [SOL] traders going short can take-profit at this level

Disclaimer: The information presented does not constitute financial, investment, trading, or other types of advice and is solely the opinion of the writer.
In a previous article, we explored how crucial the $37-$39 area was for the bulls to defend. If the bulls had been able to defend this demand zone, a move higher could have been on the cards for Solana. Yet, the selling pressure behind Bitcoin acted as a catalyst and sent many major altcoins reeling. Solana had been fighting to break above $42.5. At press time, it appeared to be headed back to a support level where the rally to $42 had begun.
SOL- 1 Day Chart
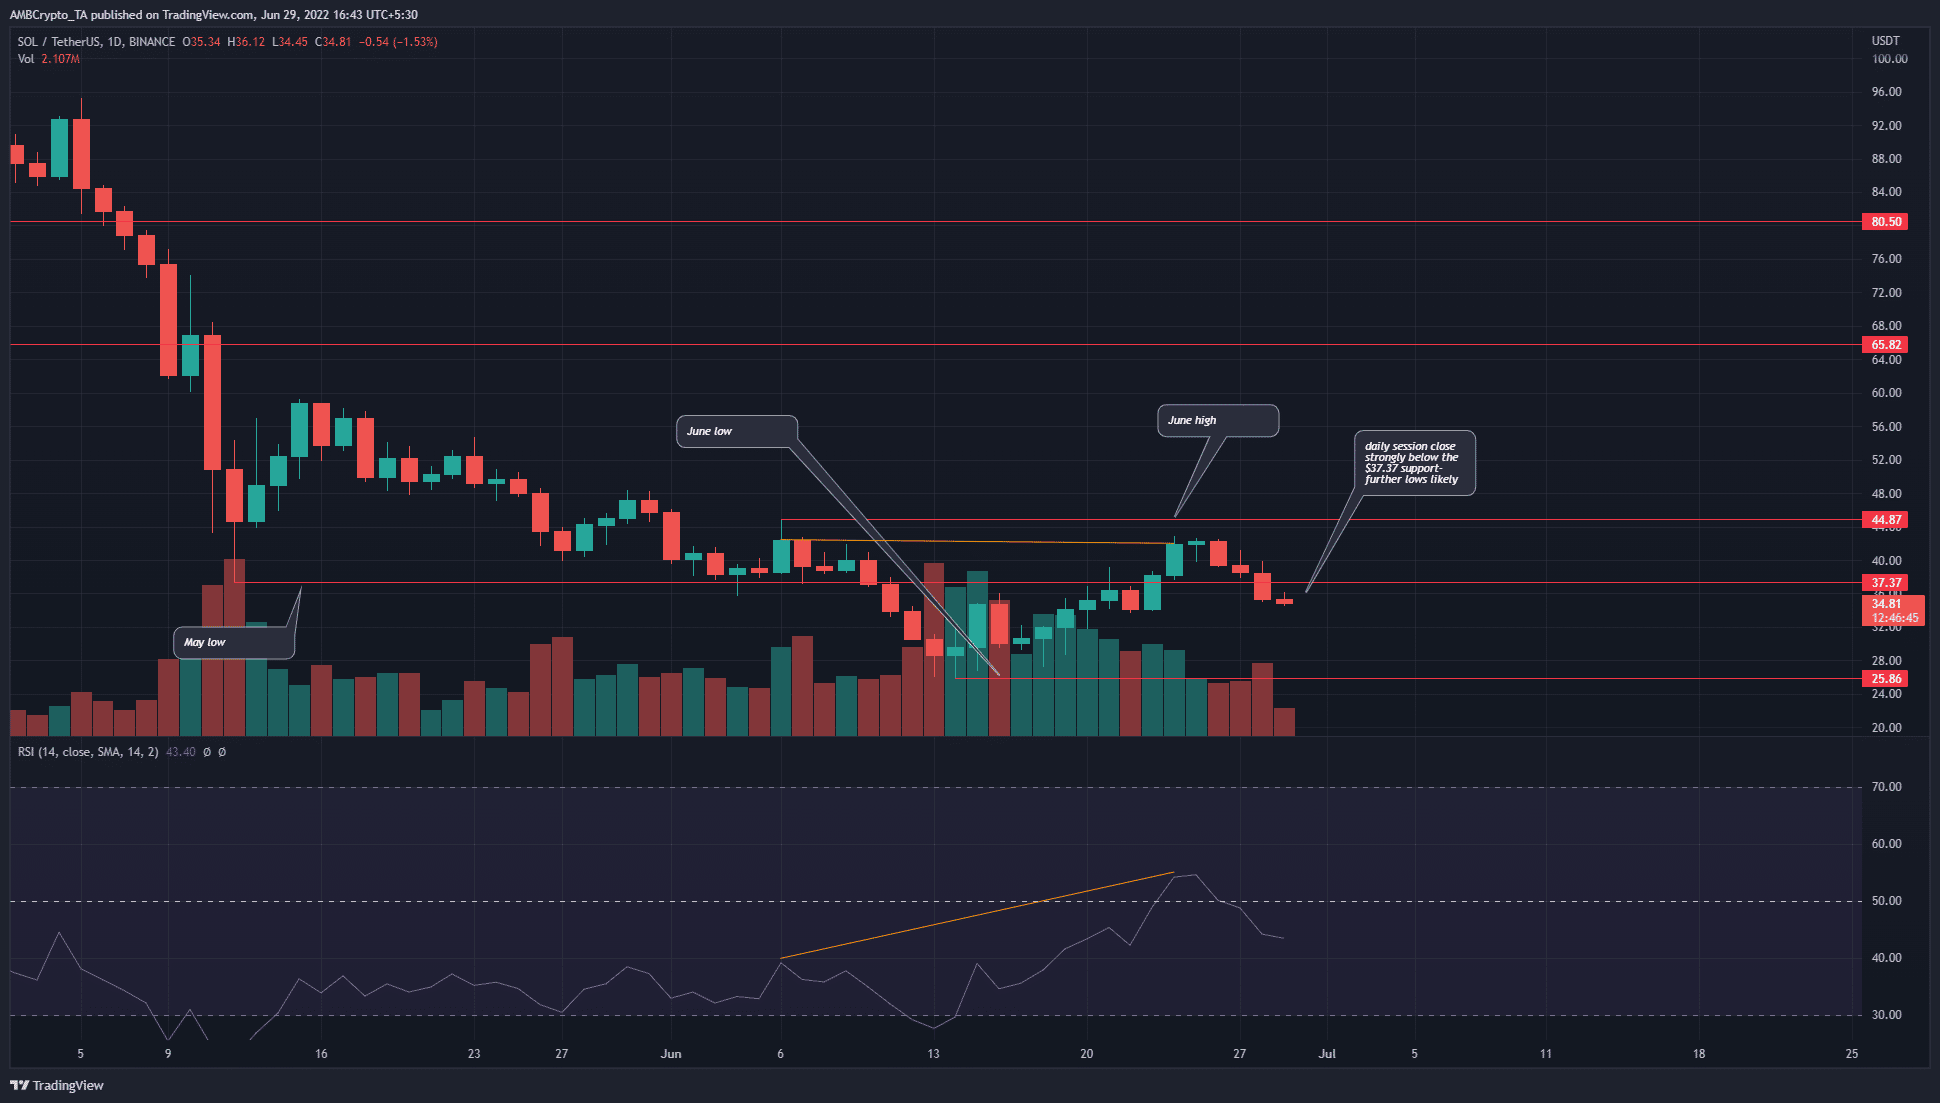
On the daily timeframe, some important levels close to the price were marked. The low of May, the swing high of June as well as the swing low, were all likely to be important levels in the weeks to come. A hidden bearish divergence (orange) developed just as the price knocked on the $42.5 mark. This signaled a continuation of the former downtrend, and SOL came tumbling down in recent days.
The swing low of May at $37.37 has acted as support and resistance over the past month. It was expected that the bulls would attempt to defend this zone, which was a support zone on lower timeframes.
Yet, the price crashed right through it and reinforced a bearish bias for Solana. Given the fact that Bitcoin also faced selling pressure, it appeared that the direction for SOL in the next few days would be southward.
SOL- 2-Hour Chart
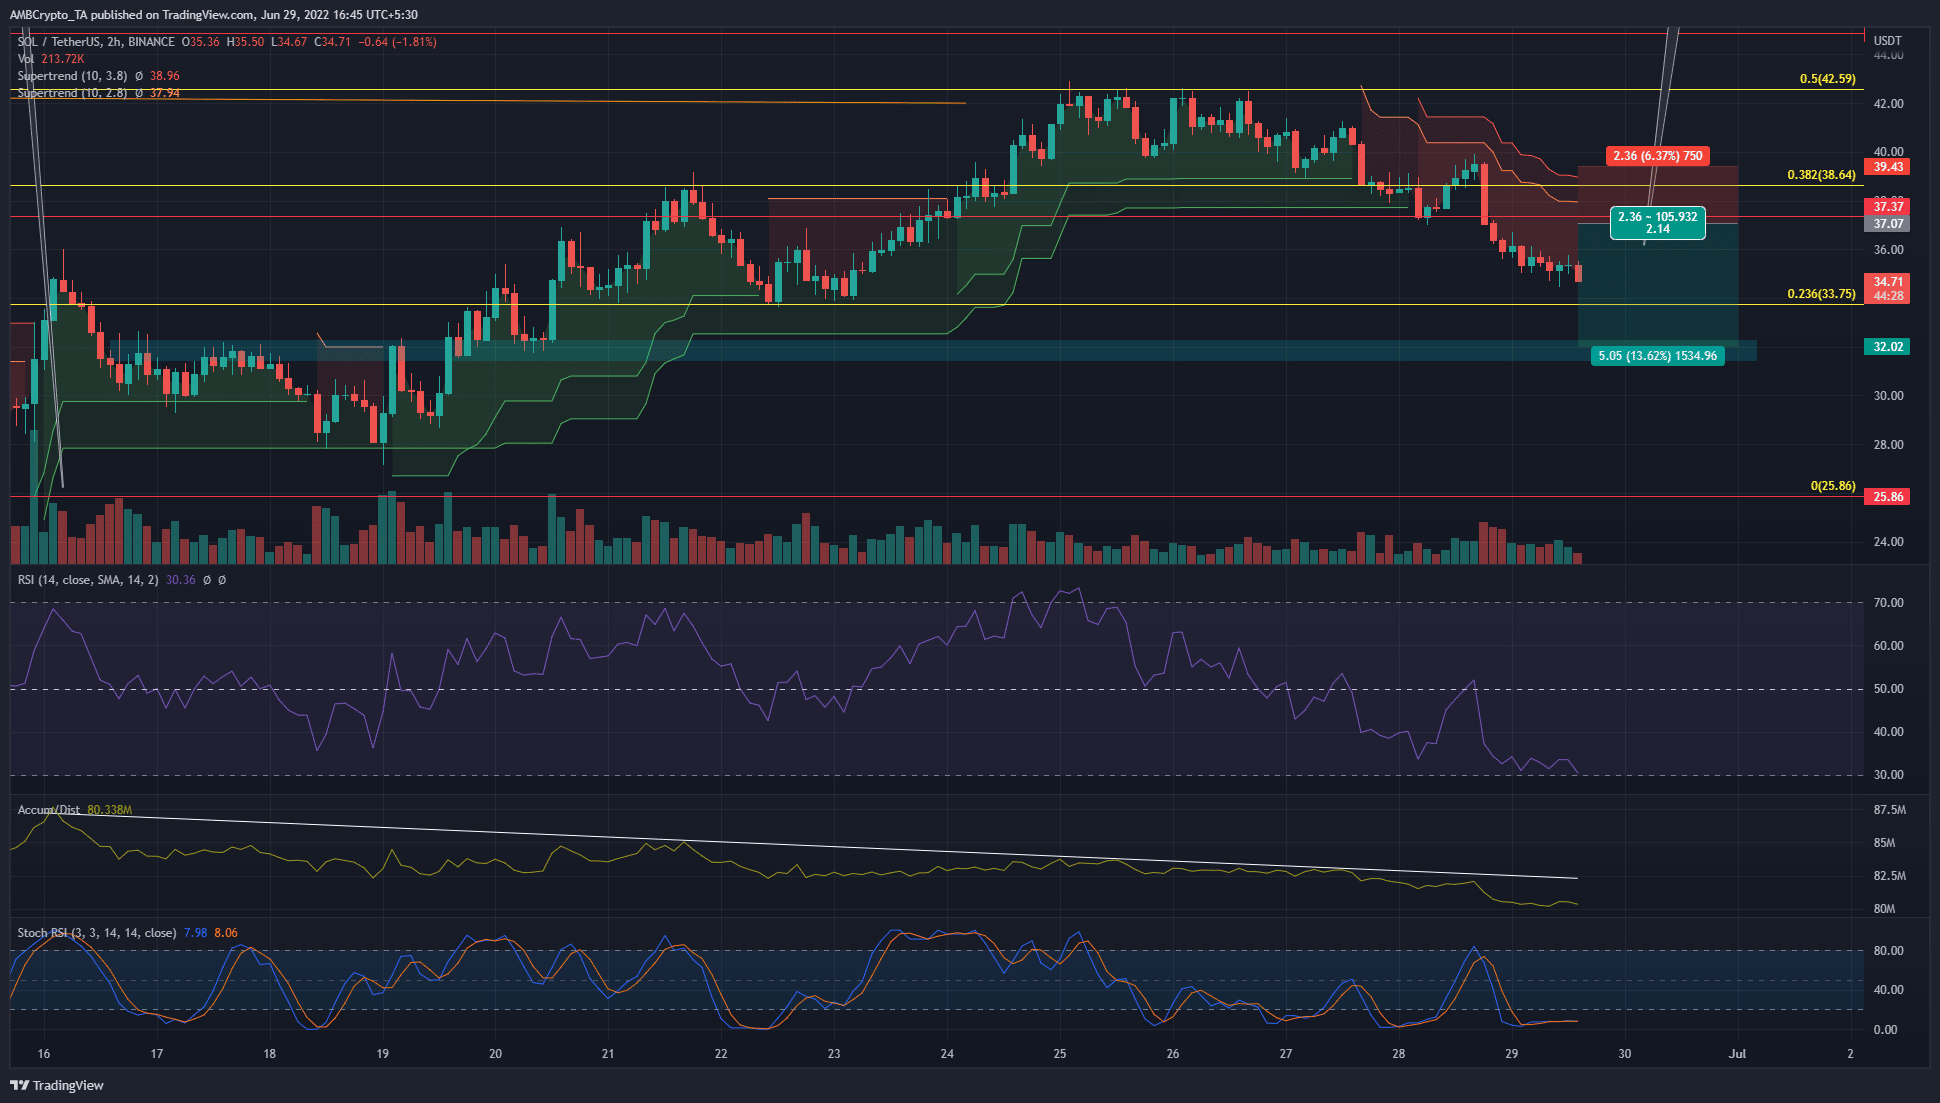
The 2-hour chart showed the price to slip beneath the 38.2%retracement level and cruise lower. The $37.37 was broken and was not yet retested as resistance. The RSI approached oversold territory, while the Stochastic RSI was in the oversold region. Hence, a possible bounce toward the $37 area could occur before a subsequent drop in prices.
There is also the possibility of a move lower without a bounce from $33.75. The A/D line has been going lower and lower, and the selling pressure could see SOL drop without a bounce.
Conclusion
The $32 region was a good area for short positions to take-profit at. A bounce to $37 could offer an ideal entry. Short positions can use the Supertrend indicators to set a stop-loss. Both the daily and the hourly timeframes showed selling pressure behind Solana.


