Solana traders positioned long can set their invalidation below…

Disclaimer: The findings of the following analysis are the sole opinions of the writer and should not be considered investment advice.
Solana [SOL] has been on a bearish trend since November 2021. Any strong rallies in the intervening time ultimately met with overwhelming selling pressure before the bulls could really reverse the trend.
At the time of writing, Solana had a bullish bias on lower timeframes, but the long-term chart showed that not a lot has changed. Despite the recovery from $29 last month, the $50-$65 region could oppose further advances.
SOL- 1-Day Chart
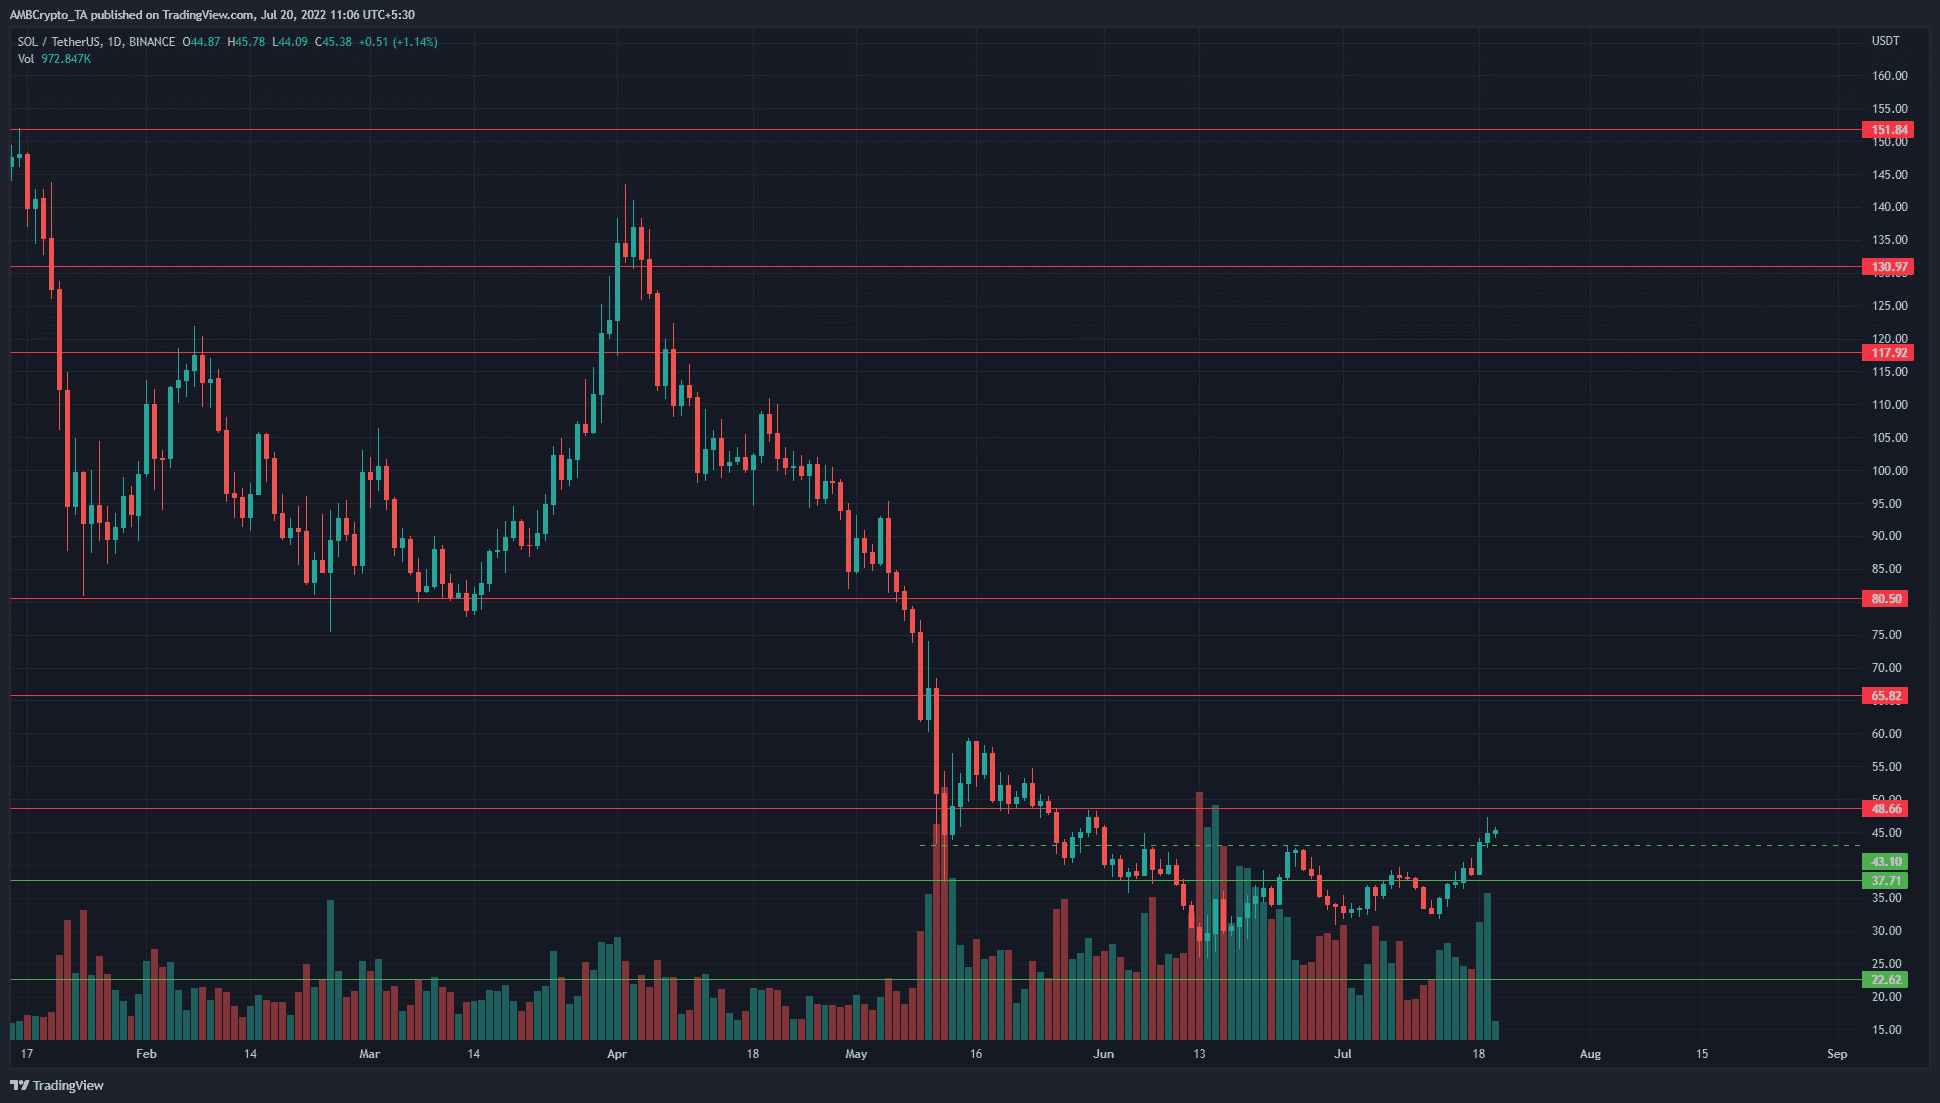
On the higher timeframe charts, SOL appeared to beckon the bulls toward money and profits. The $43 resistance from early June was finally beaten and even retested as support. To the north, the $50, $60 and $65 levels were significant resistance levels.
On lower timeframes, the $48, $53 and $57 levels were ones to watch out for. Yet, the question remains- how much higher can Solana rally?
As ever, the future is uncertain. However, the longer-term bias indicated that SOL could push higher now that the $43 mark was beaten. Hence, traders positioned long can set their invalidation below the $43-$42 area.
The $55-$60 region can be used to take a profit, while $65 would be a more ambitious target.
Rationale
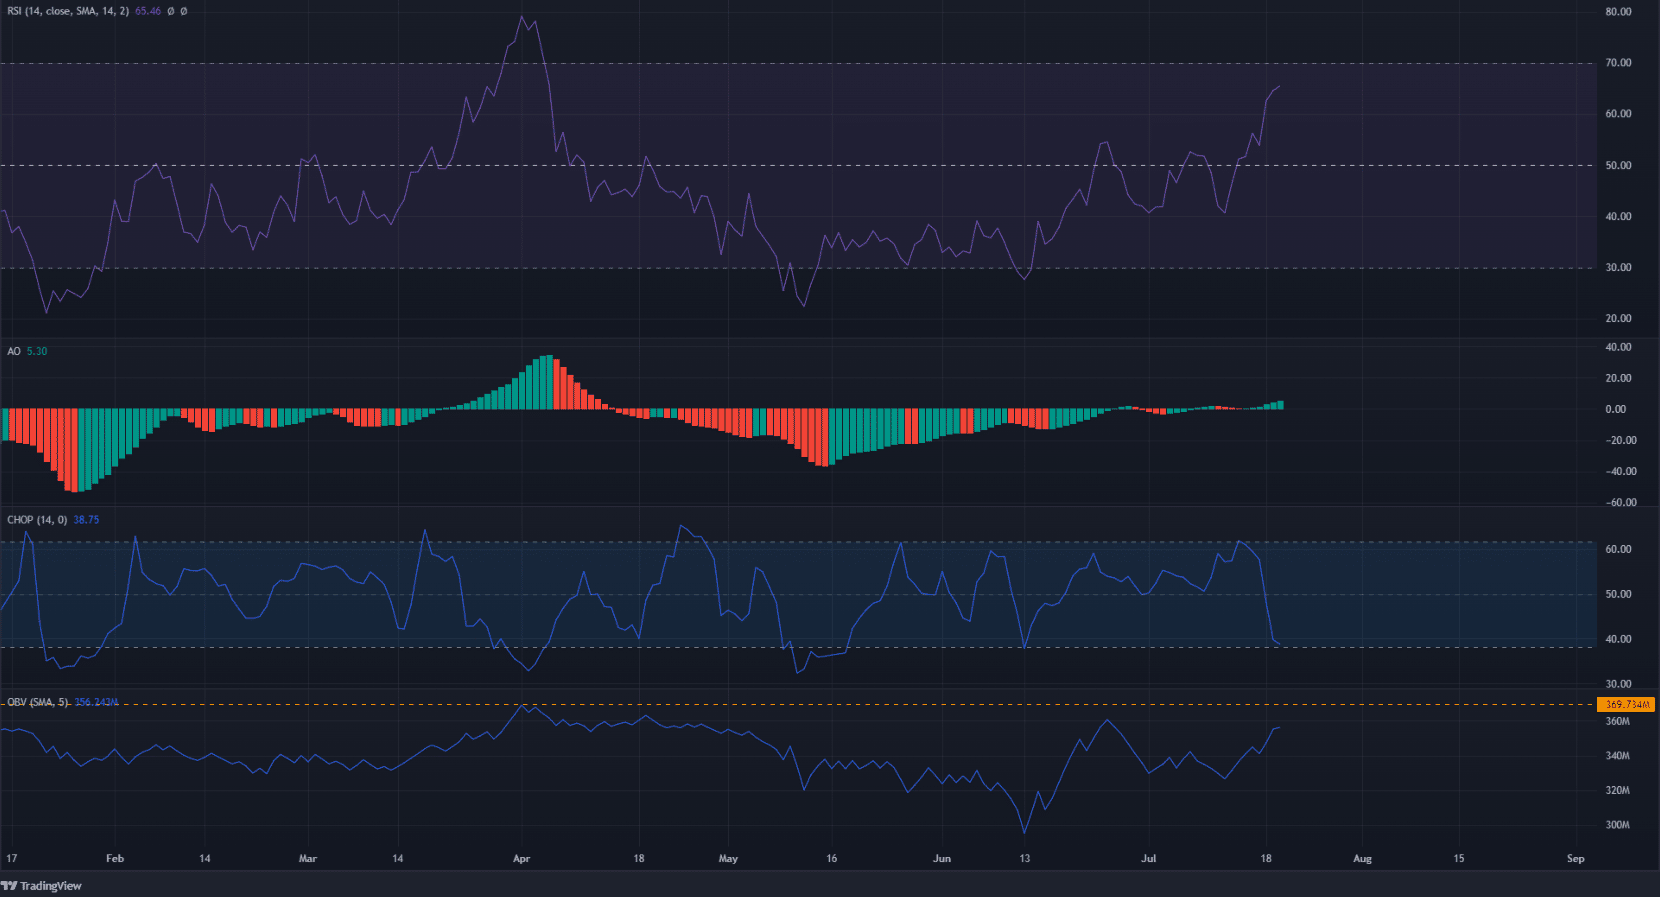
The Relative Strength Index (RSI) climbed back above the neutral 50 line on the charts, while the Awesome Oscillator (AO) also maintained its position above the zero line. Both these indicators highlighted bullish momentum behind Solana even on higher timeframes.
The Choppiness index stood at 38.75 to show that a strong trend was just around the corner. The most encouraging indicator for the bulls was the On-Balance Volume (OBV).
The orange dotted line highlighted a resistance from October. The April downtrend saw a rejection of this resistance. Could another test of this resistance and rejection be seen in the next week or two, or can the OBV break above it?
Conclusion
Even though the indicators began to look bullish on higher timeframes, it must be remembered that Bitcoin [BTC] faced intense resistance all the way to $30k.
Important areas to watch out for are the $24.4k, $26k, and $27.8k levels. The current Solana rally can be ridden higher but traders must be ready to flip their bias to bearish if key support levels such as $42 are broken.


