Solana’s network activity stats in Q2 can help you trade
Solana, house to leading projects such as Serum, Mango Markets, StepN, Magic Eden, and Star Atlas, has seen tremendous ecosystem growth in the last month.
With increased activity on the network, data from Santiment showed that the last three months had been marked by a 105% spike in the network’s social media mentions and 170.94% in its social engagements.
Recently following the release of the y00ts NFT project, Solana recorded a daily NFT volume of 344,000 SOL, marking the highest daily volume since the previous all-time high was set in May.
Given its growth in the last month, let’s assess the network’s performance in the last quarter.
Solana in Q2
In a new report, blockchain analytics platform, Nansen, offered insights into the performance of Solana in the second quarter of the year (between 1 April – 30 June).
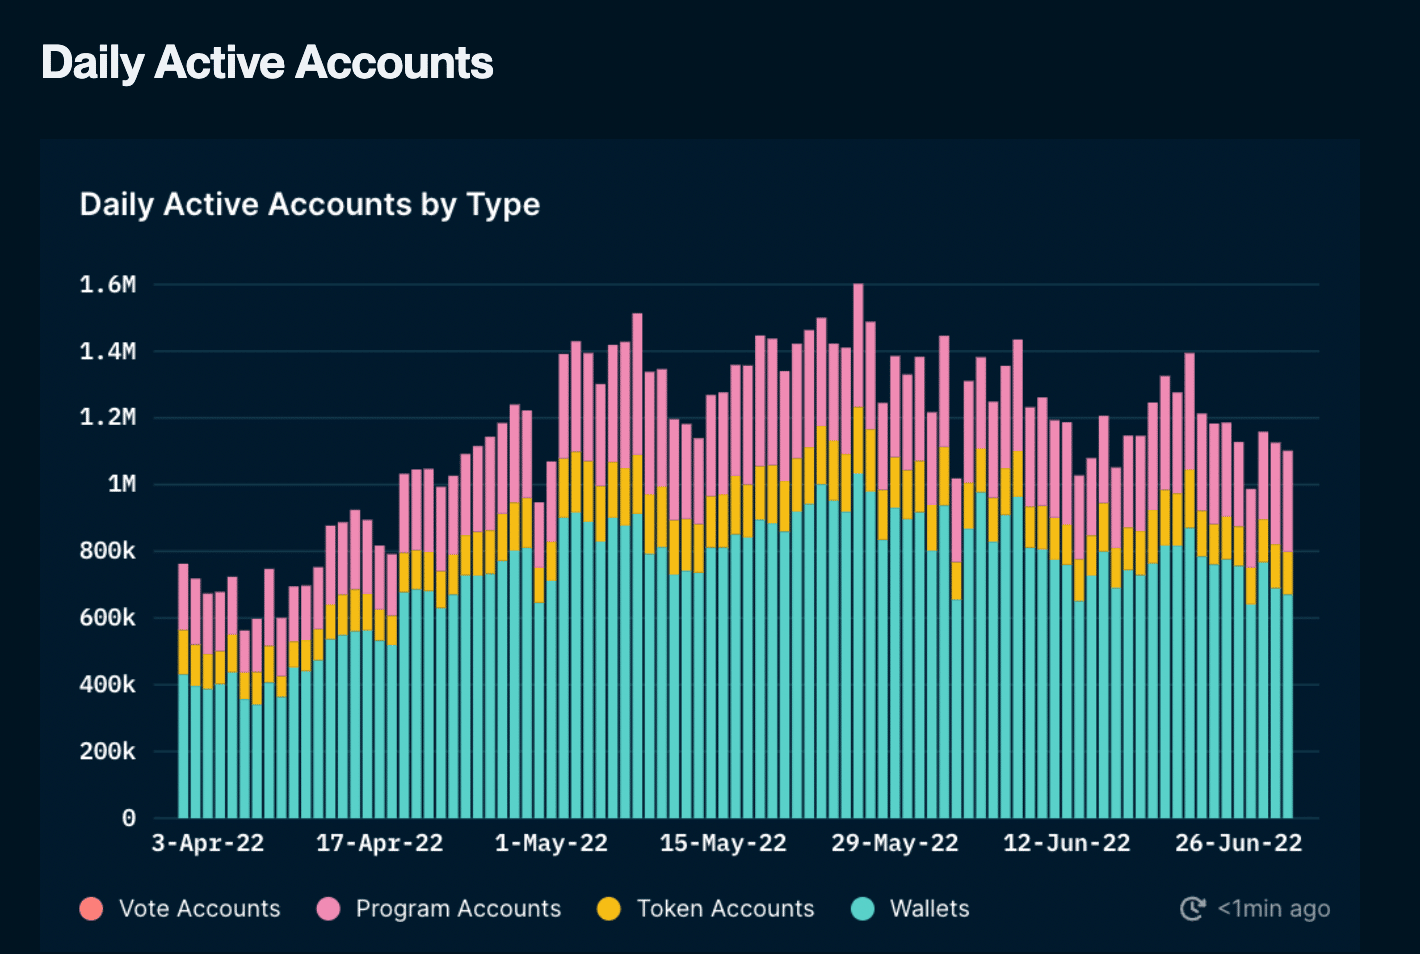
According to the report, Solana saw growth in activities on the network within the period under review. Active accounts on Solana increased from 400,000 at the beginning of April to about one million by the end of May.
In addition, daily active accounts on the network oscillated between 600,000 and one million within the period under review. By 30 June, Solana had logged over 1.1 million daily active accounts.
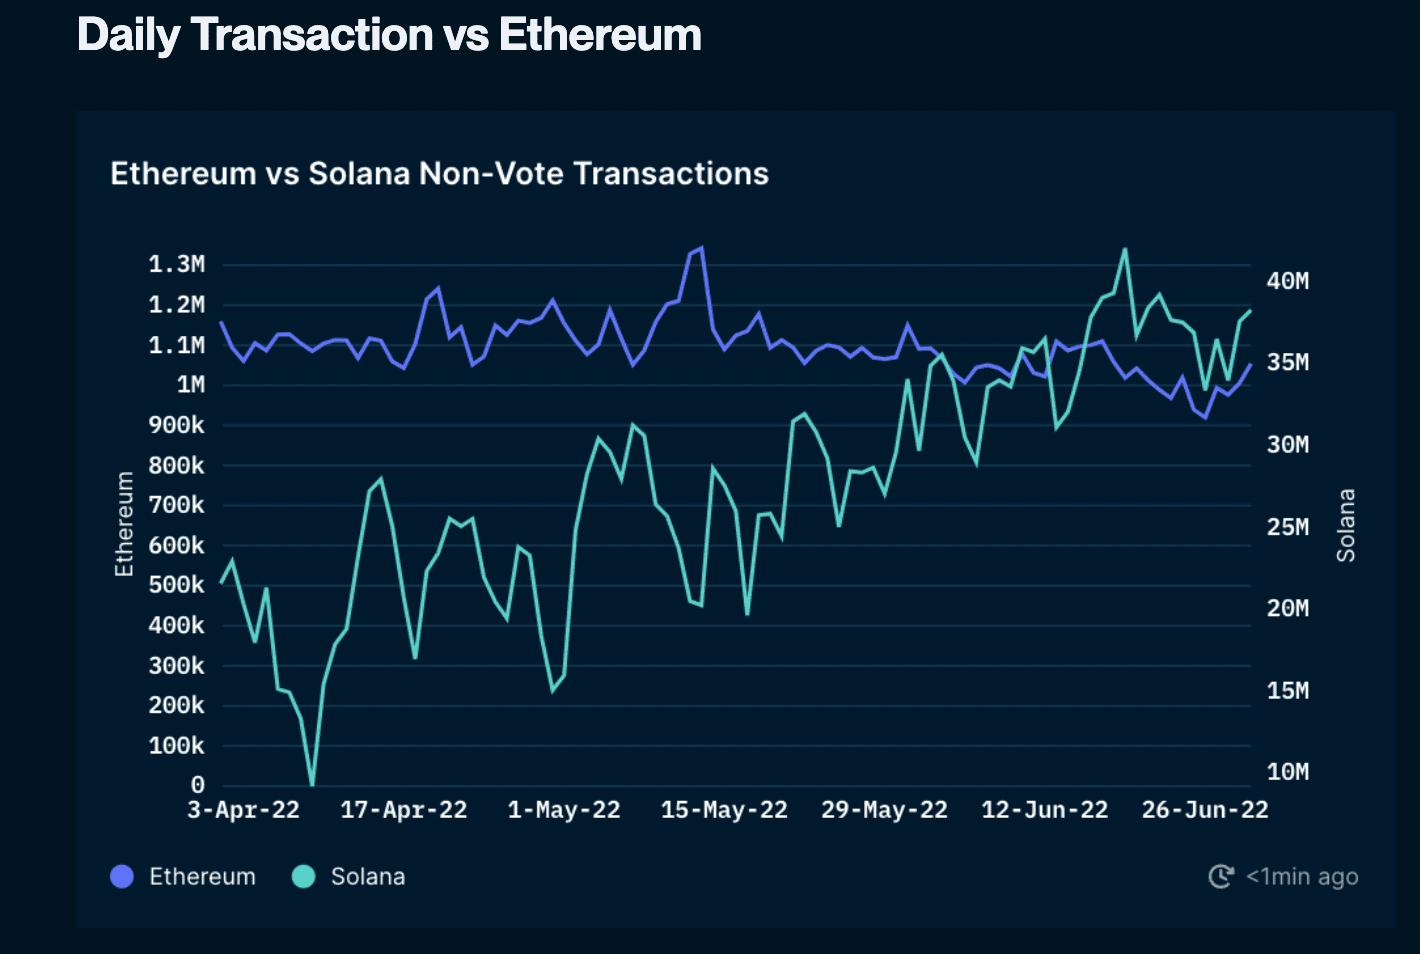
Daily transactions on Solana also grew between the 91-day period under review. According to Nansen, the biggest transactions on Solana in the quarter were vote transactions, totaling around 100 million to 200 million per day.
While other kinds of transactions declined at the beginning of April, they increased from the middle of the month till the close of the quarter.

Nansen found further that in the last quarter, Solana recorded more daily transactions than Ethereum did.
While daily transactions on Solana rallied in the period under review, “Ethereum’s daily transactions have been relatively stable throughout the quarter, hovering around 1m+ transactions.”
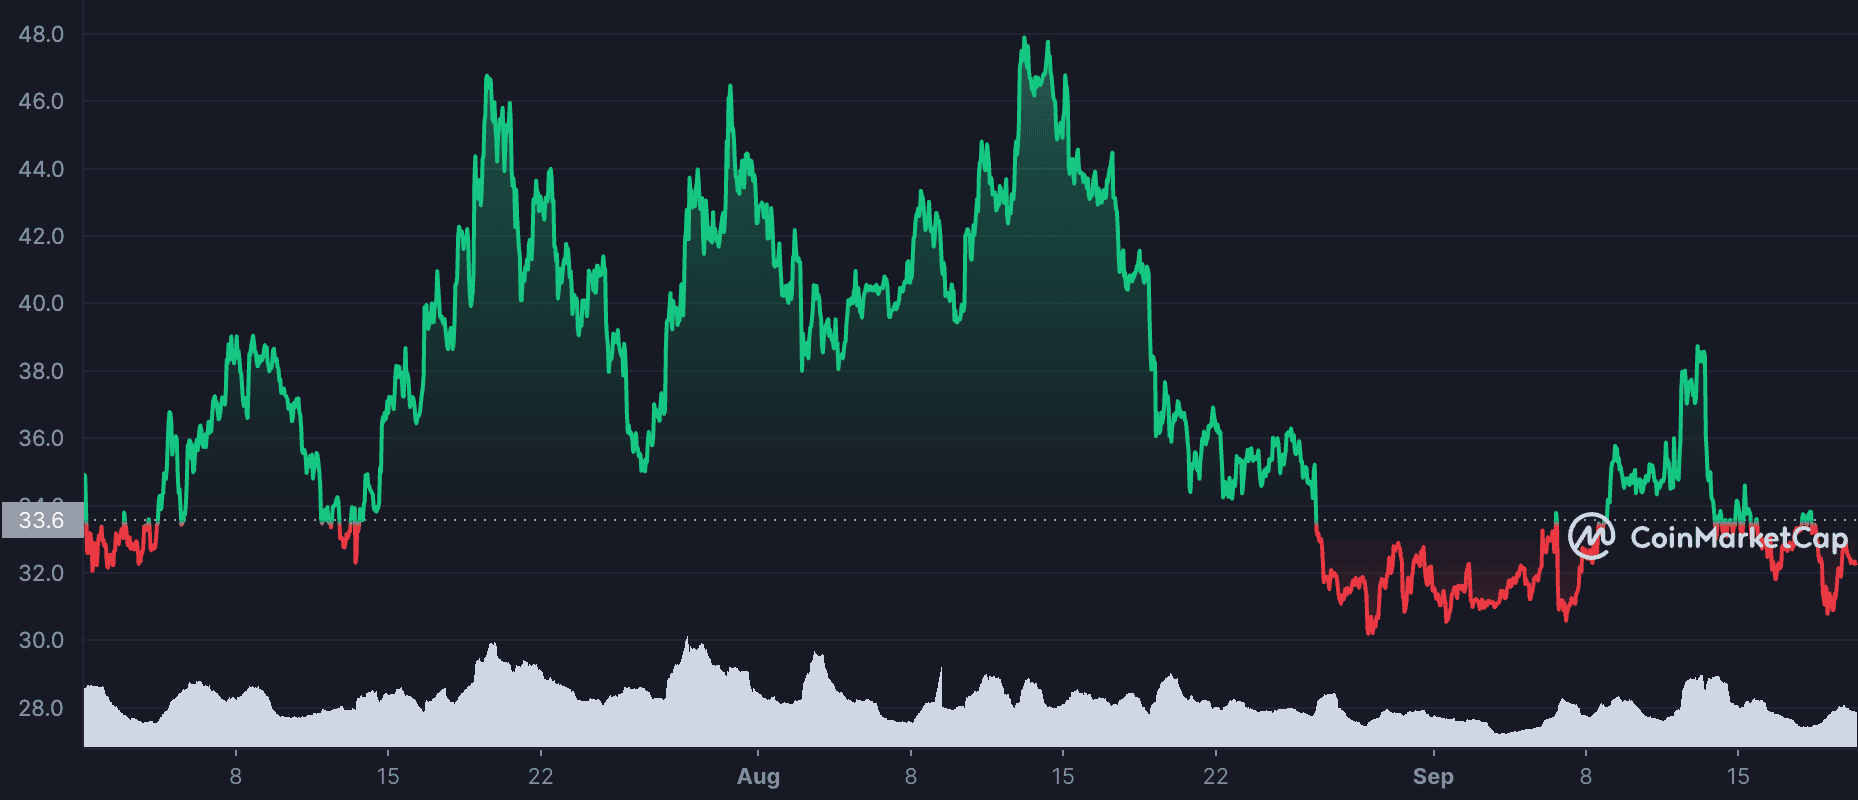
Impacted by the decline in the general cryptocurrency market in the quarter as a result of the collapse of Terra, the price of SOL went down by 74%, data from CoinMarketCap revealed.
This price decline contributed to users paying less gas fees to process transactions on Solana in Q2. According to Nansen,
“Daily gas paid on Solana was volatile from the beginning of the quarter up to mid-May, before eventually stabilizing within the $5-9k range.”
SOL so far in Q3
At press time, the price of SOL, the #9 largest cryptocurrency, stood at $32.23. In this quarter, SOL attained its highest price point of $47.64 on 13 August. Since then, its price has gone down by 33%.