Solana’s price is expected to head in this direction in the next 24-hours

Volatility is the name of the game in the crypto-verse. Over the years, tokens have seen unconventional price fluctuations in short spans of time. While a few market participants have been able to make profits and capitalize on the same, most others choose to remain cautious and stay away from the market during such periods.
Now, among the top 10 crypto assets, Solana’s price has oscillated the most in the last 7-days. The current fifth largest coin has shed more than 13% of its value in the past week. Other coins from the same top 10 list, have either appreciated or depreciated by not more than 7% in the same time frame.
Gauging the on-going trend
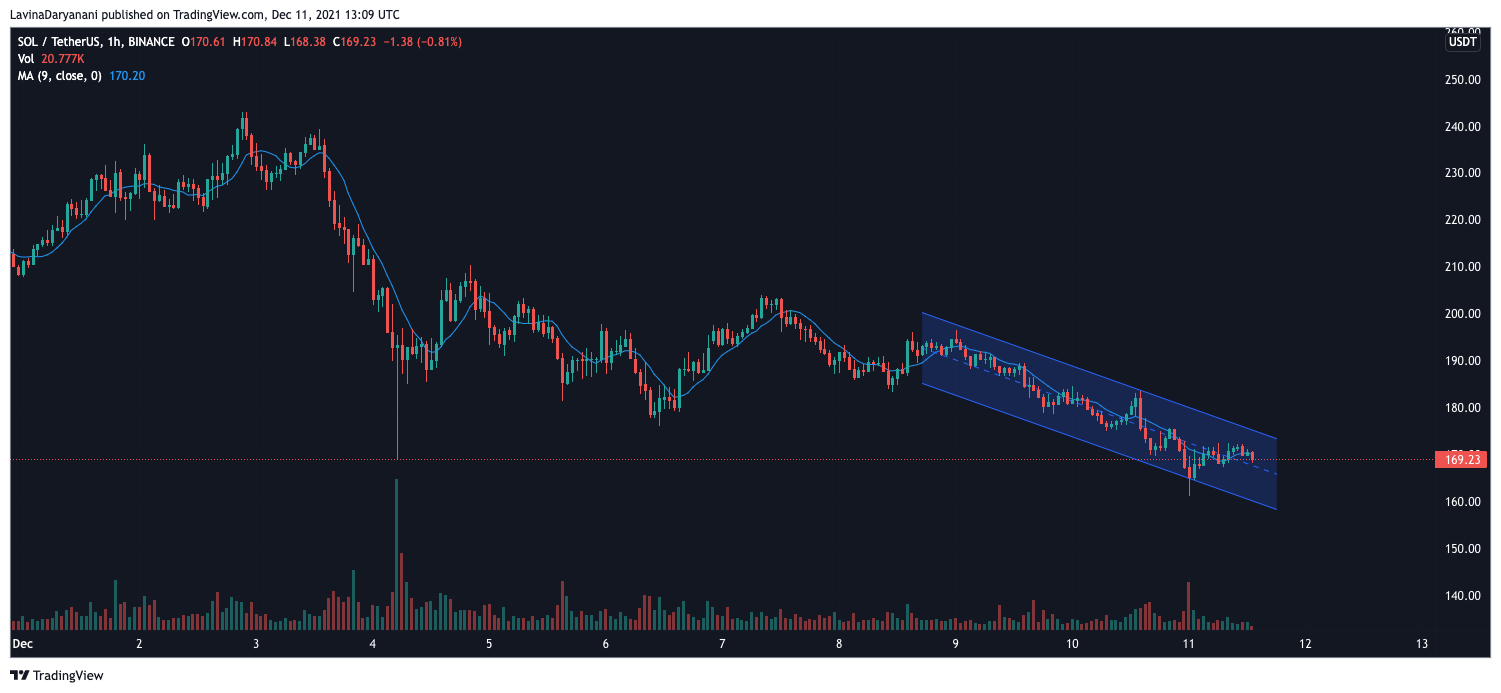
On the 1-hour chart, Solana’s price has been encapsulated within a descending channel. During the early hours of Saturday it briefly broke below the lower trendline, but soon managed to slide back up.
Now, over the past few hours SOL’s price has been moving horizontally.
Vigilance at its peak
So, to know in which direction would it next head, let’s analyze the collective sentiment of traders in the futures market. To start with, let’s peek into the Open Interest.
As can be seen from the snapshot attached below, SOL’s OI has been shrinking since the mid of November. From the aforementioned period’s $1.91 billion peak, the same has now fallen to a level around $800 million.
The evident erosion of OI essentially means that open positions have gradually been closed by traders. It also implies that new traders aren’t very keen on entering into the market at the moment.
Ergo, with not much new money entering into the ecosystem, it would be challenging for SOL to shrug off its monotonous downtrend phase and initiate a change in direction.

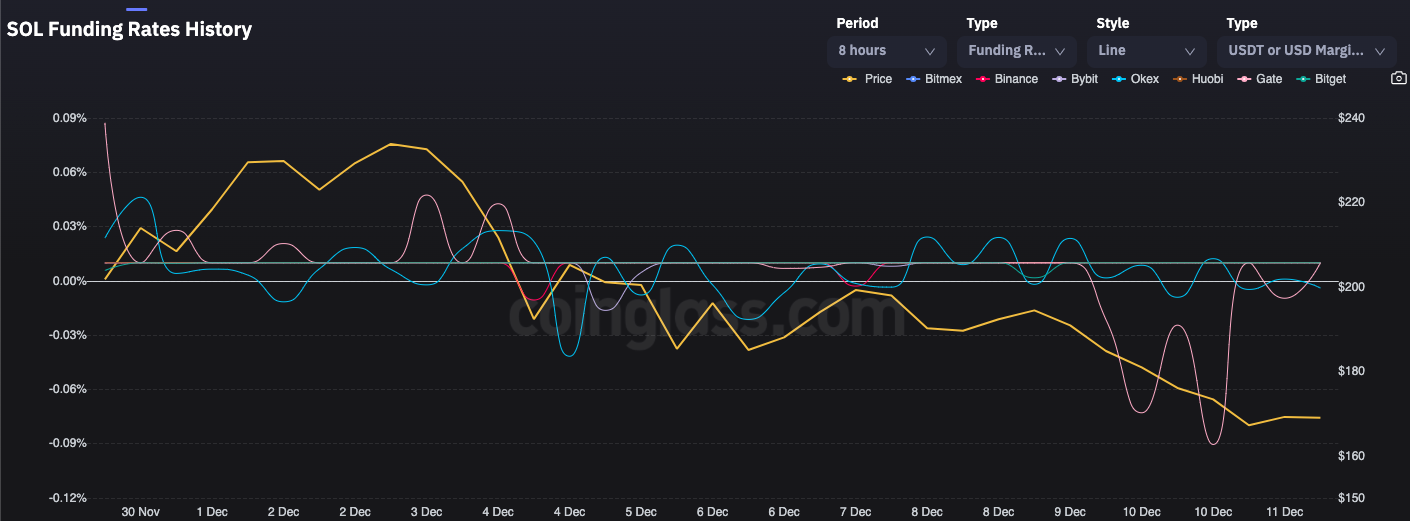
The funding rate across most major exchanges has, however, stepped back into the positive territory. Only on OKEx, the rate was slightly negative [-0.003922]. Now, the turnaround in the direction of most of the exchanges’ curves highlight that long traders have started demanding more leverage than their short counterparts.
However, the intensity of positivity isn’t that high at the moment indicating the insecurity in the minds of leveraged traders.
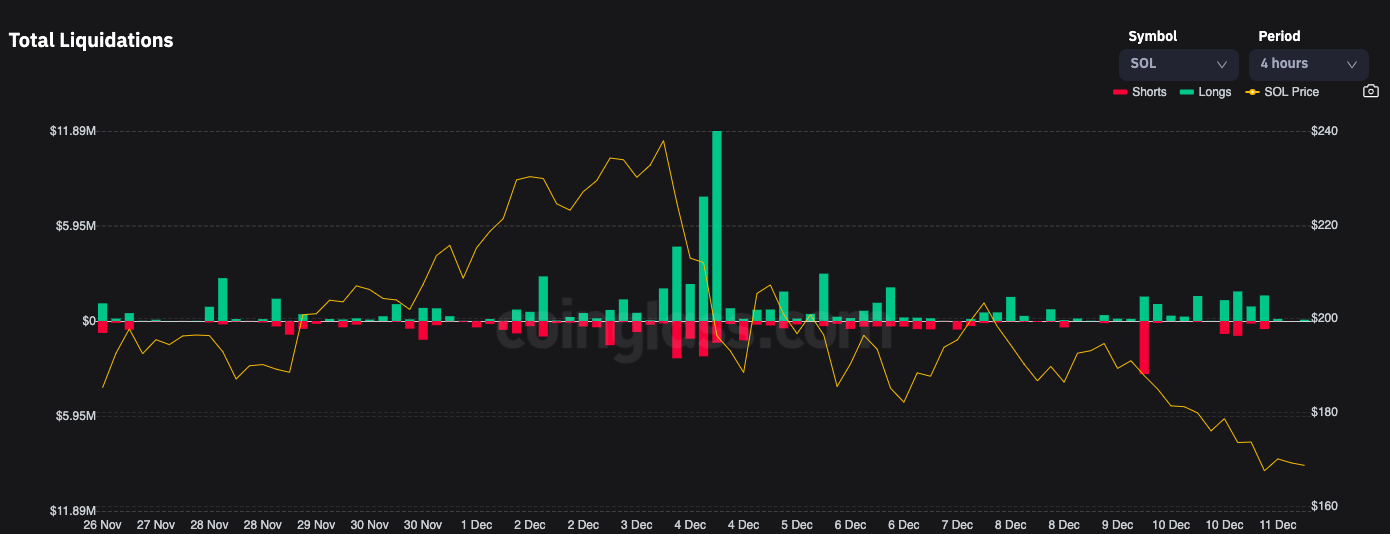
Further, the liquidation chart did not look that dreadful or imposing either. The cumulative value of both long and short liquidations over the past 12 hours accounted to merely $234.5k at the time of writing. Thus, with such meagre amount of liquidations, not much can be said about which category of traders the market is currently backing.
In fact, the long : short ratio too did not depict any clear-cut trend at the time of writing. The number of bets placed on both the sides were more or less even.
Thus, the aforementioned trends bring to light that traders are quite cautious now. So, at this point, it can be contended that SOL’s price wouldn’t change much over the next few trading sessions, unless the wider market pumps or dumps. Market participants, in turn, can expect SOL to continue projecting horizontal movements on its price chart over the next day.


