Stellar Lumens, Augur, VeChain Price Analysis: 29 January

Stellar Lumens approached the upper boundary of its range with bullish momentum, but was rejected, and would need to rise above $0.33 to achieve a breakout. Augur formed a triangle pattern and could retest the $17.3-level once more before embarking on a strong move. Finally, VeChain appeared likely to lose a level of support at $0.0268 and head towards $0.022.
Stellar Lumens [XLM]
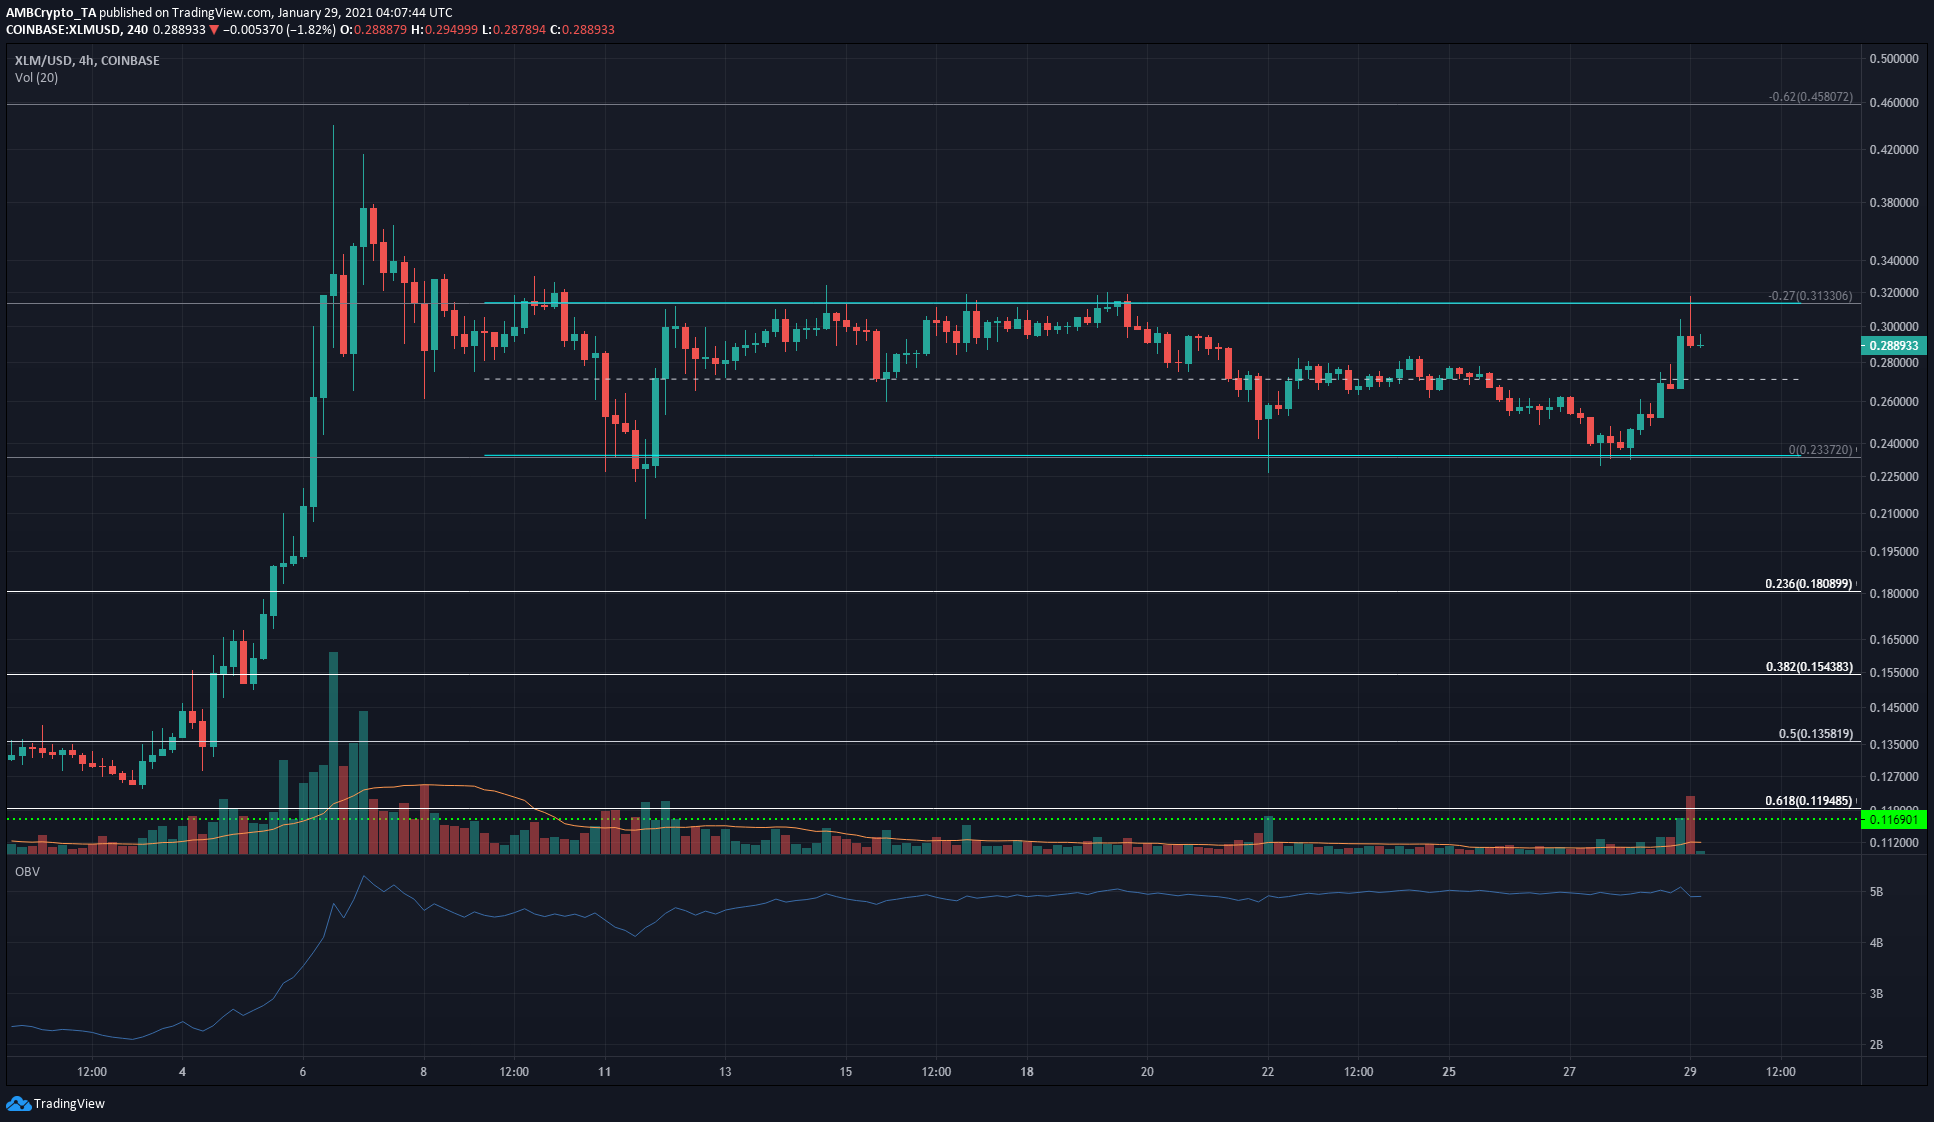
Stellar Lumens has been trading within the range of $0.23 to $0.31 for nearly three weeks now. In that period, the OBV underlined that buying and selling volumes have been more or less equal, in comparison to the buying volume that accompanied the prior surge up from $0.128.
The momentum was with the bulls, however, an attempted move past the upper boundary of the range was strongly pushed down. This could see a retest of the mid-point of the range before another move towards $0.31.
The $0.31-$0.33 range has been an area dominated by selling pressure in recent weeks, and XLM bulls would need to flip this area into one of demand before affecting another strong move south.
Augur [REP]
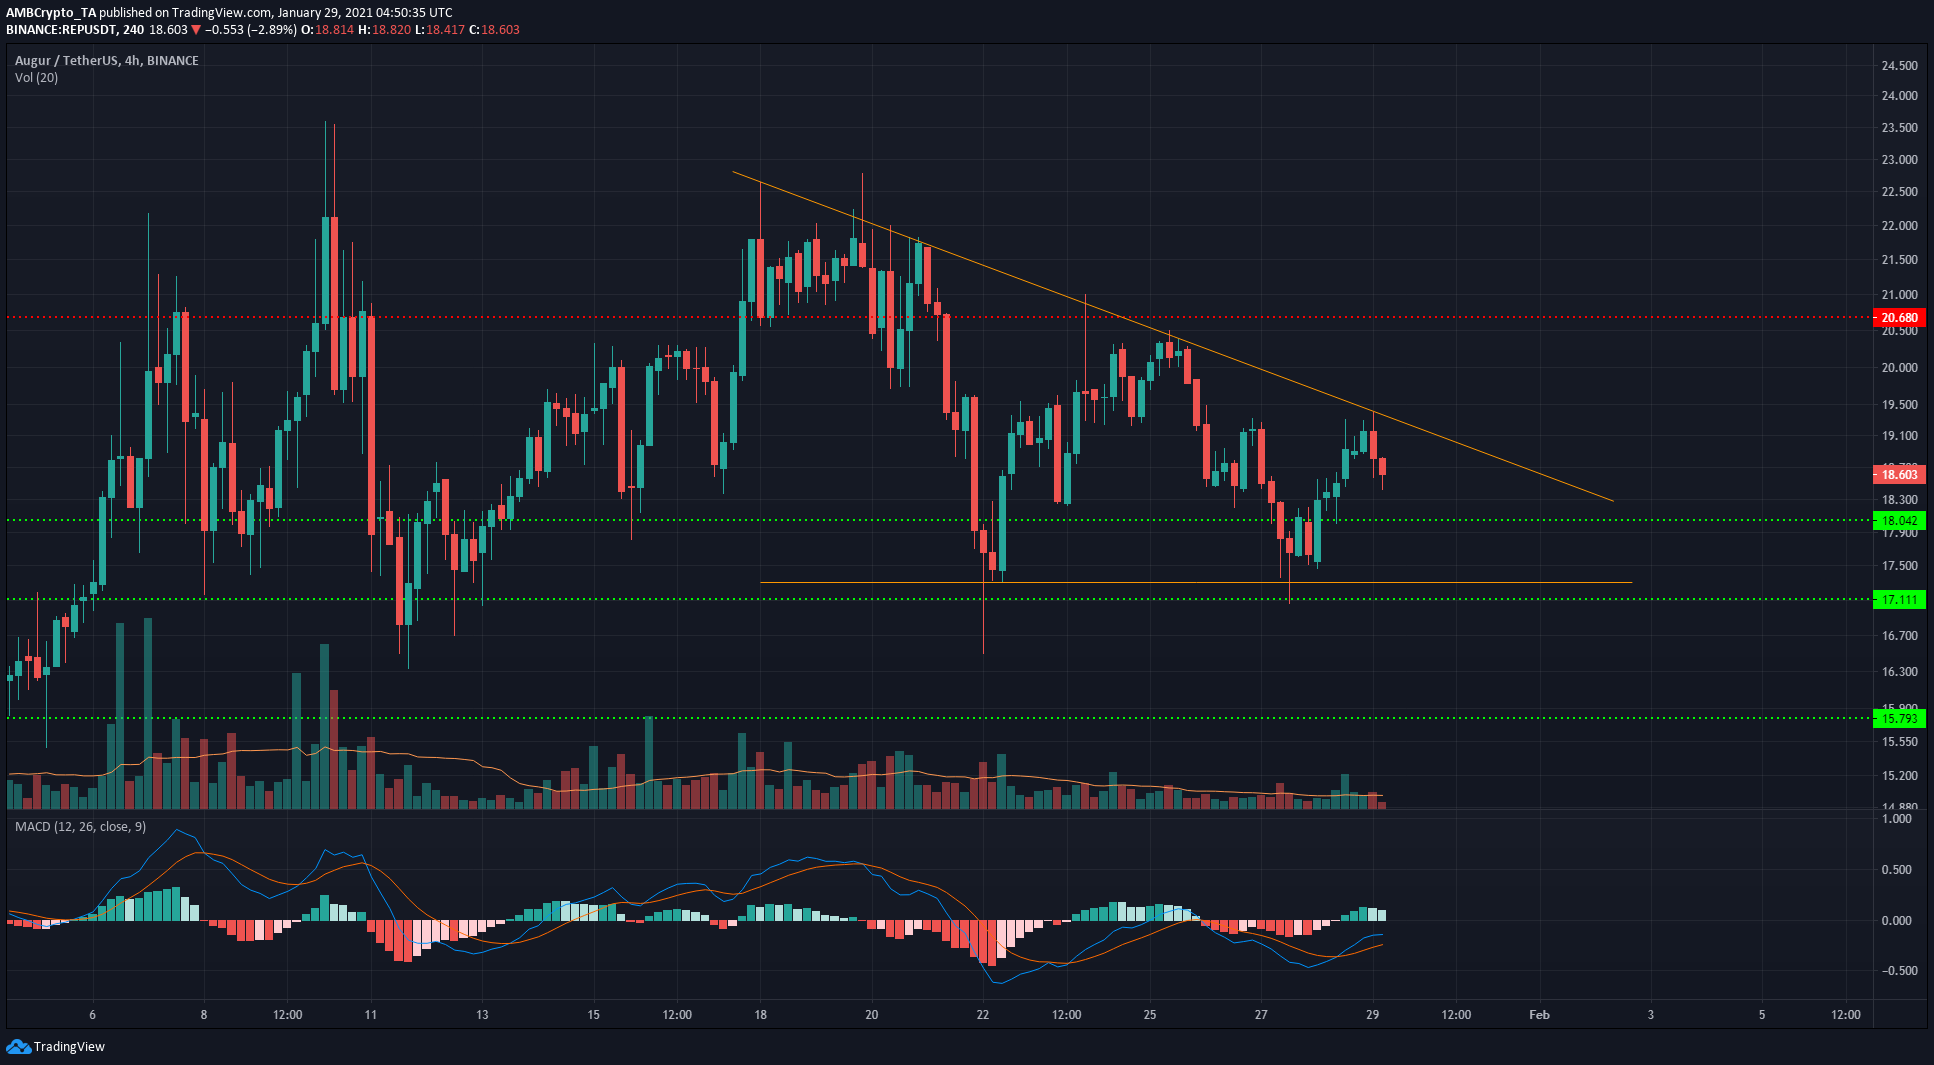
Augur formed a descending triangle pattern on the 4-hour chart. This is a triangle pattern that usually sees a breakout to the upside. Its base was at the $17.31-mark, and the trading volume has been decreasing for the duration that the price has traded within the pattern.
The MACD showed a weak buy signal, at the time of writing, but the MACD and Signal lines were under zero and pointed to general bearish pressure, something highlighted by the series of lower highs set over the past few days.
The $18-level of support might not hold in the face of short-term selling pressure. A trading session close outside of the pattern and backed by heavy trading volume would underline the direction of the breakout.
VeChain [VET]
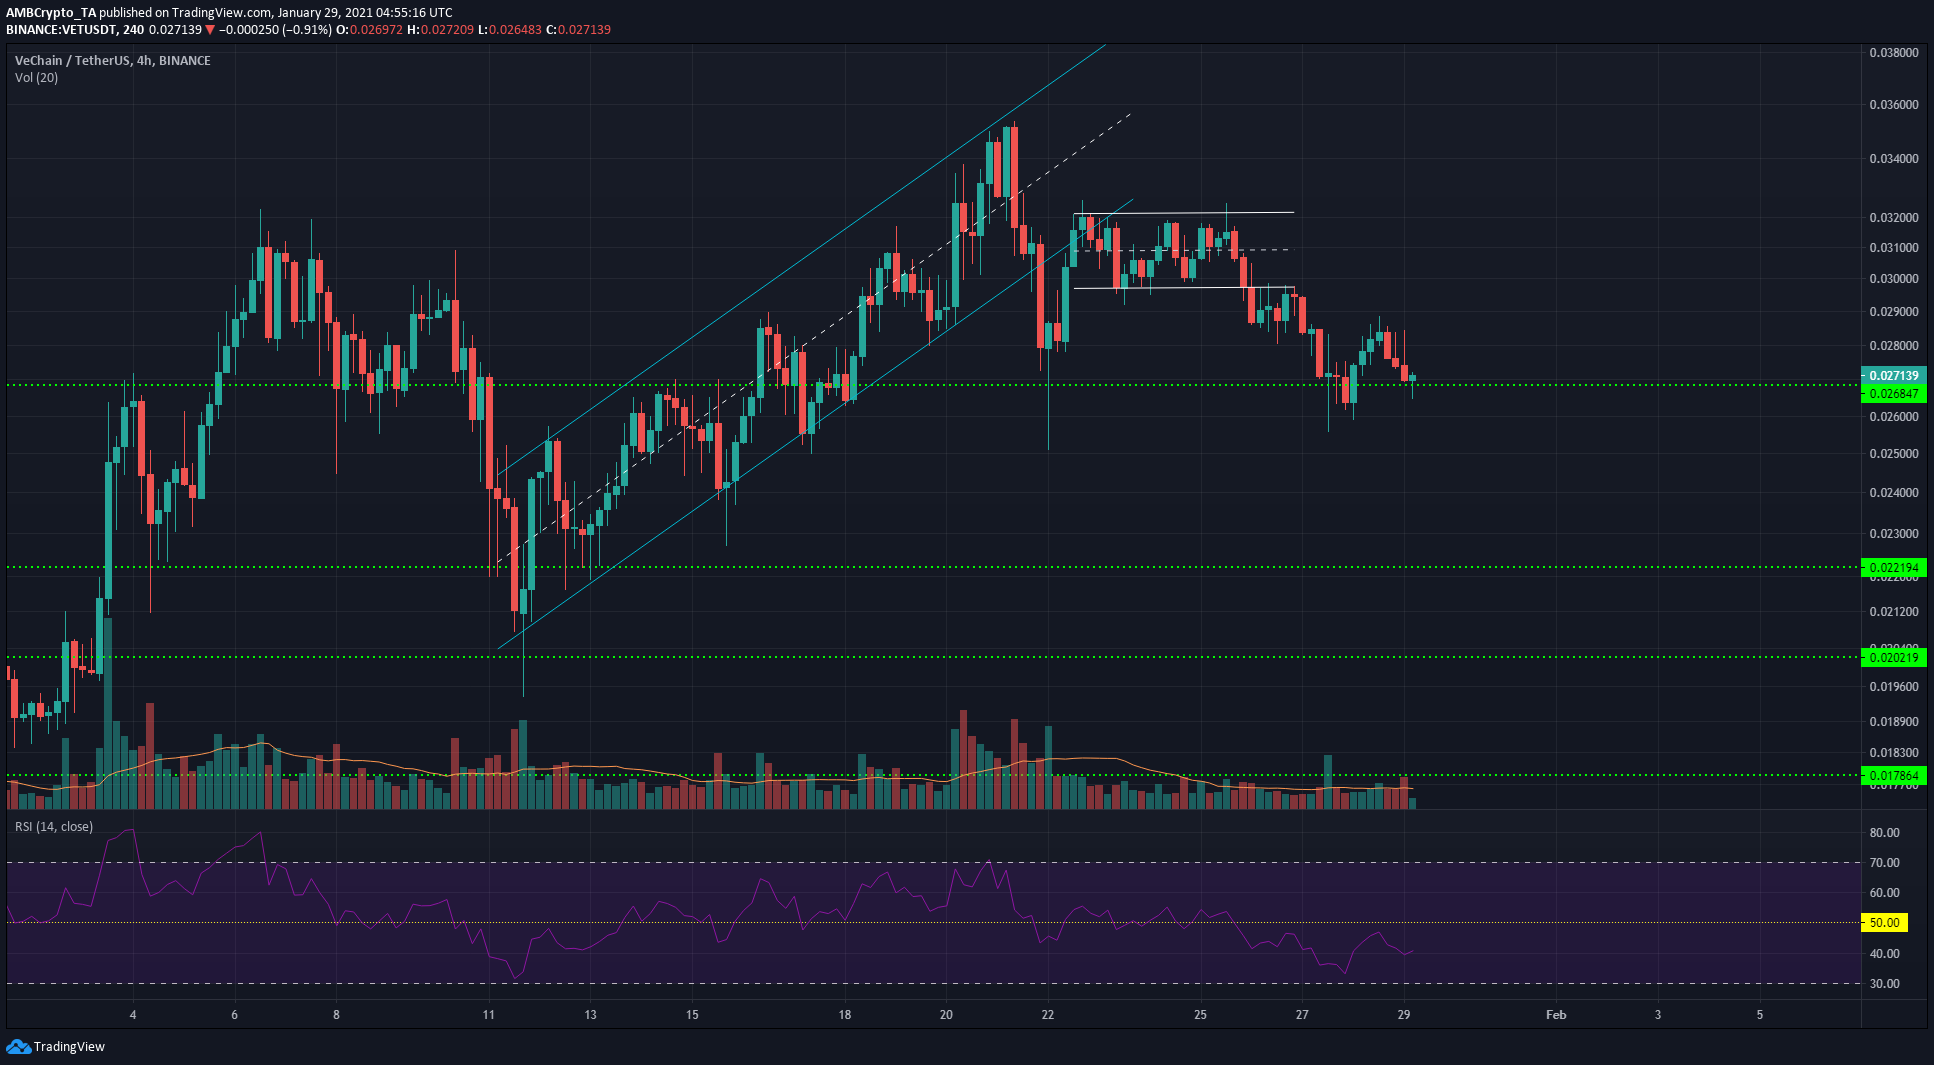
VeChain closed under the ascending channel (cyan) to trade sideways for a few days within a range (white) before the bearish pressure forced VET to close under the lower boundary and retest it as resistance as well.
At the time of writing, VET was attempting to defend the $0.0268-level of support, but it appeared likely that the bears would win this battle.
The RSI was below 50 and pointed to a downtrend in progress. The ascending channel pattern is a bearish reversal pattern that sees the price retrace back toward the base of the channel – In this instance, a downside target upon losing $0.0268 would be $0.022 for VET.