Stellar Lumens, Chainlink, Filecoin Price Analysis: 27 March

Stellar Lumens faced resistance at the $0.38 level and was forced to pull back, while Chainlink climbed above $26.7. Filecoin showed a bearish divergence and highlighted an attractive area to buy at.
Stellar Lumens [XLM]
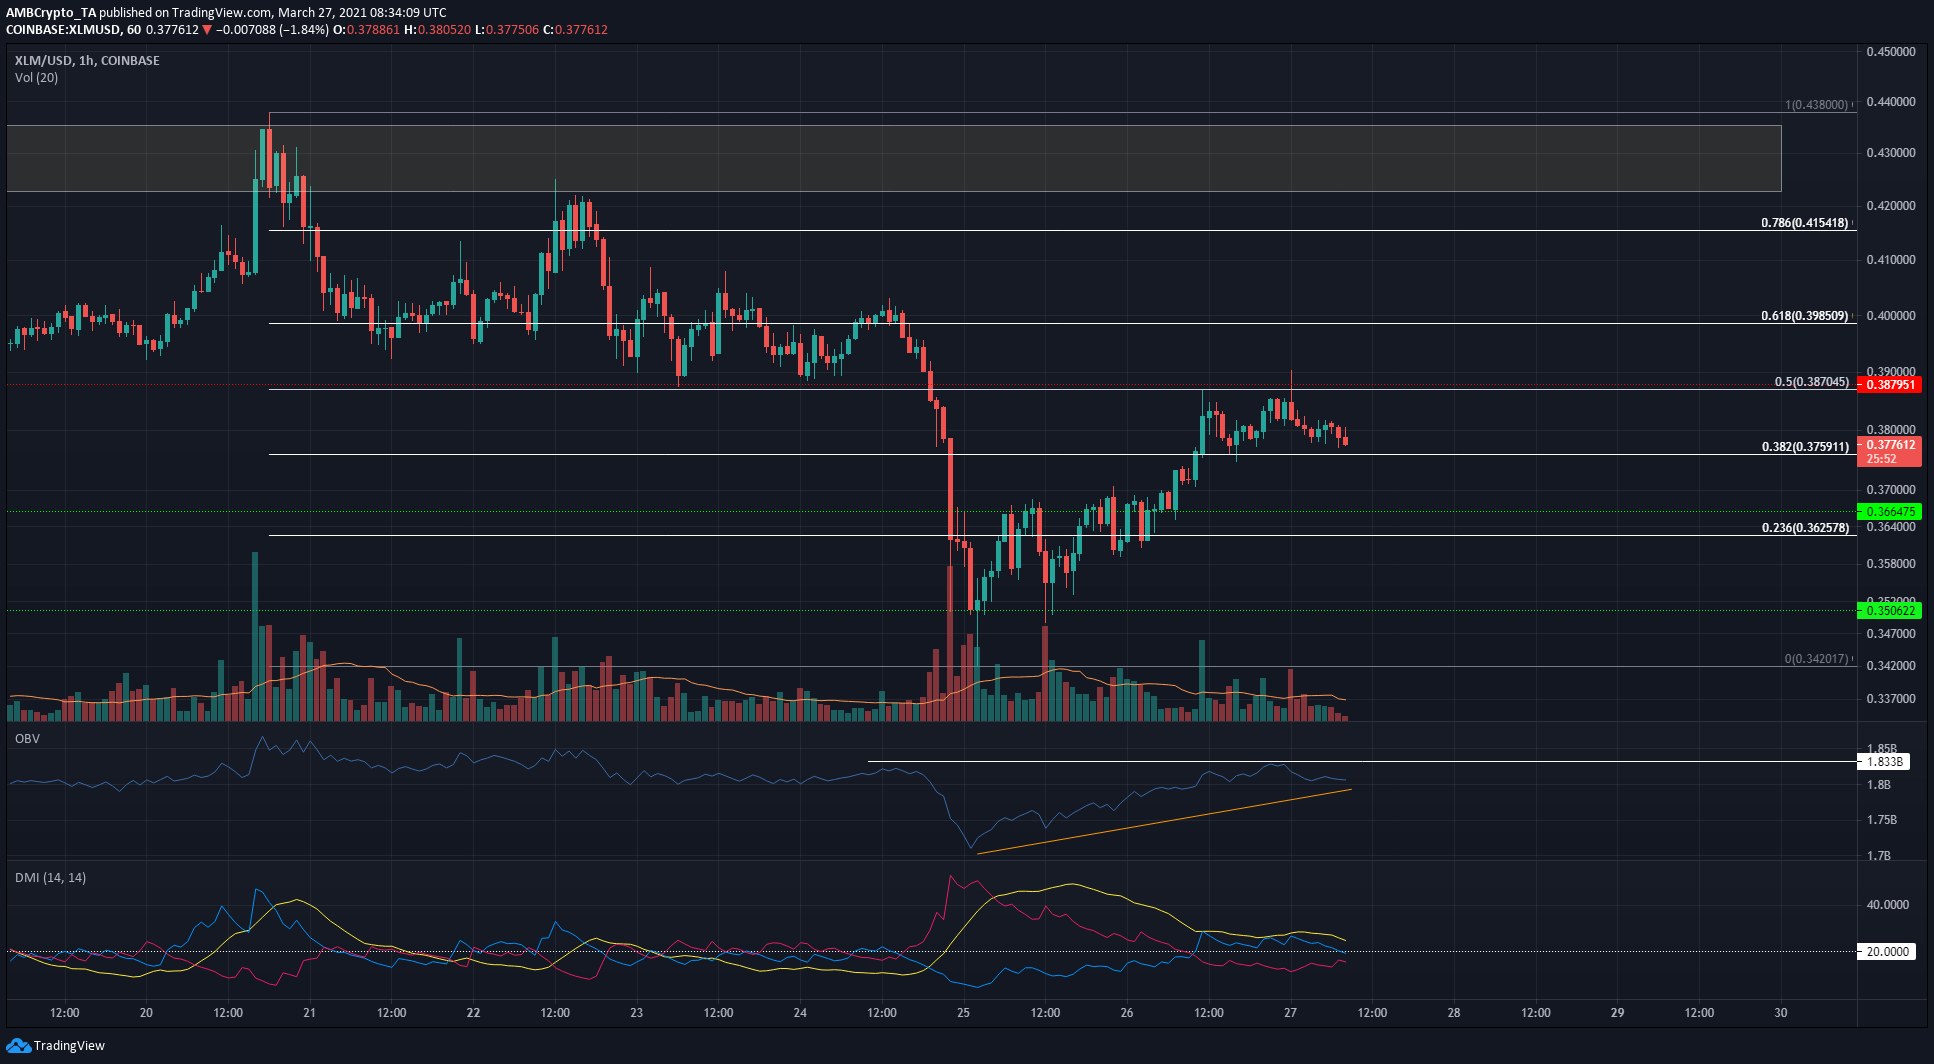
The past week has been bearish for XLM, following yet another rejection at the $0.43 region of supply. Over the past month, XLM has consolidated between the $0.438 and $0.36 levels, with some deviations to either side of these boundaries.
In the short-term, the bias for XLM lost its bullish steam after rejection at the 50% retracement level at $0.387. This could prompt another descent beneath the $0.375 mark, as the Directional Movement Index showed that the uptrend had lost strength.
There was some buying behind the recent bounce shown on the OBV, but the reaction on a retest of $0.375 would indicate whether another slide is in the making.
Flipping $0.387 to support would be a sign to buy XLM, to sell at the supply zone.
Chainlink [LINK]
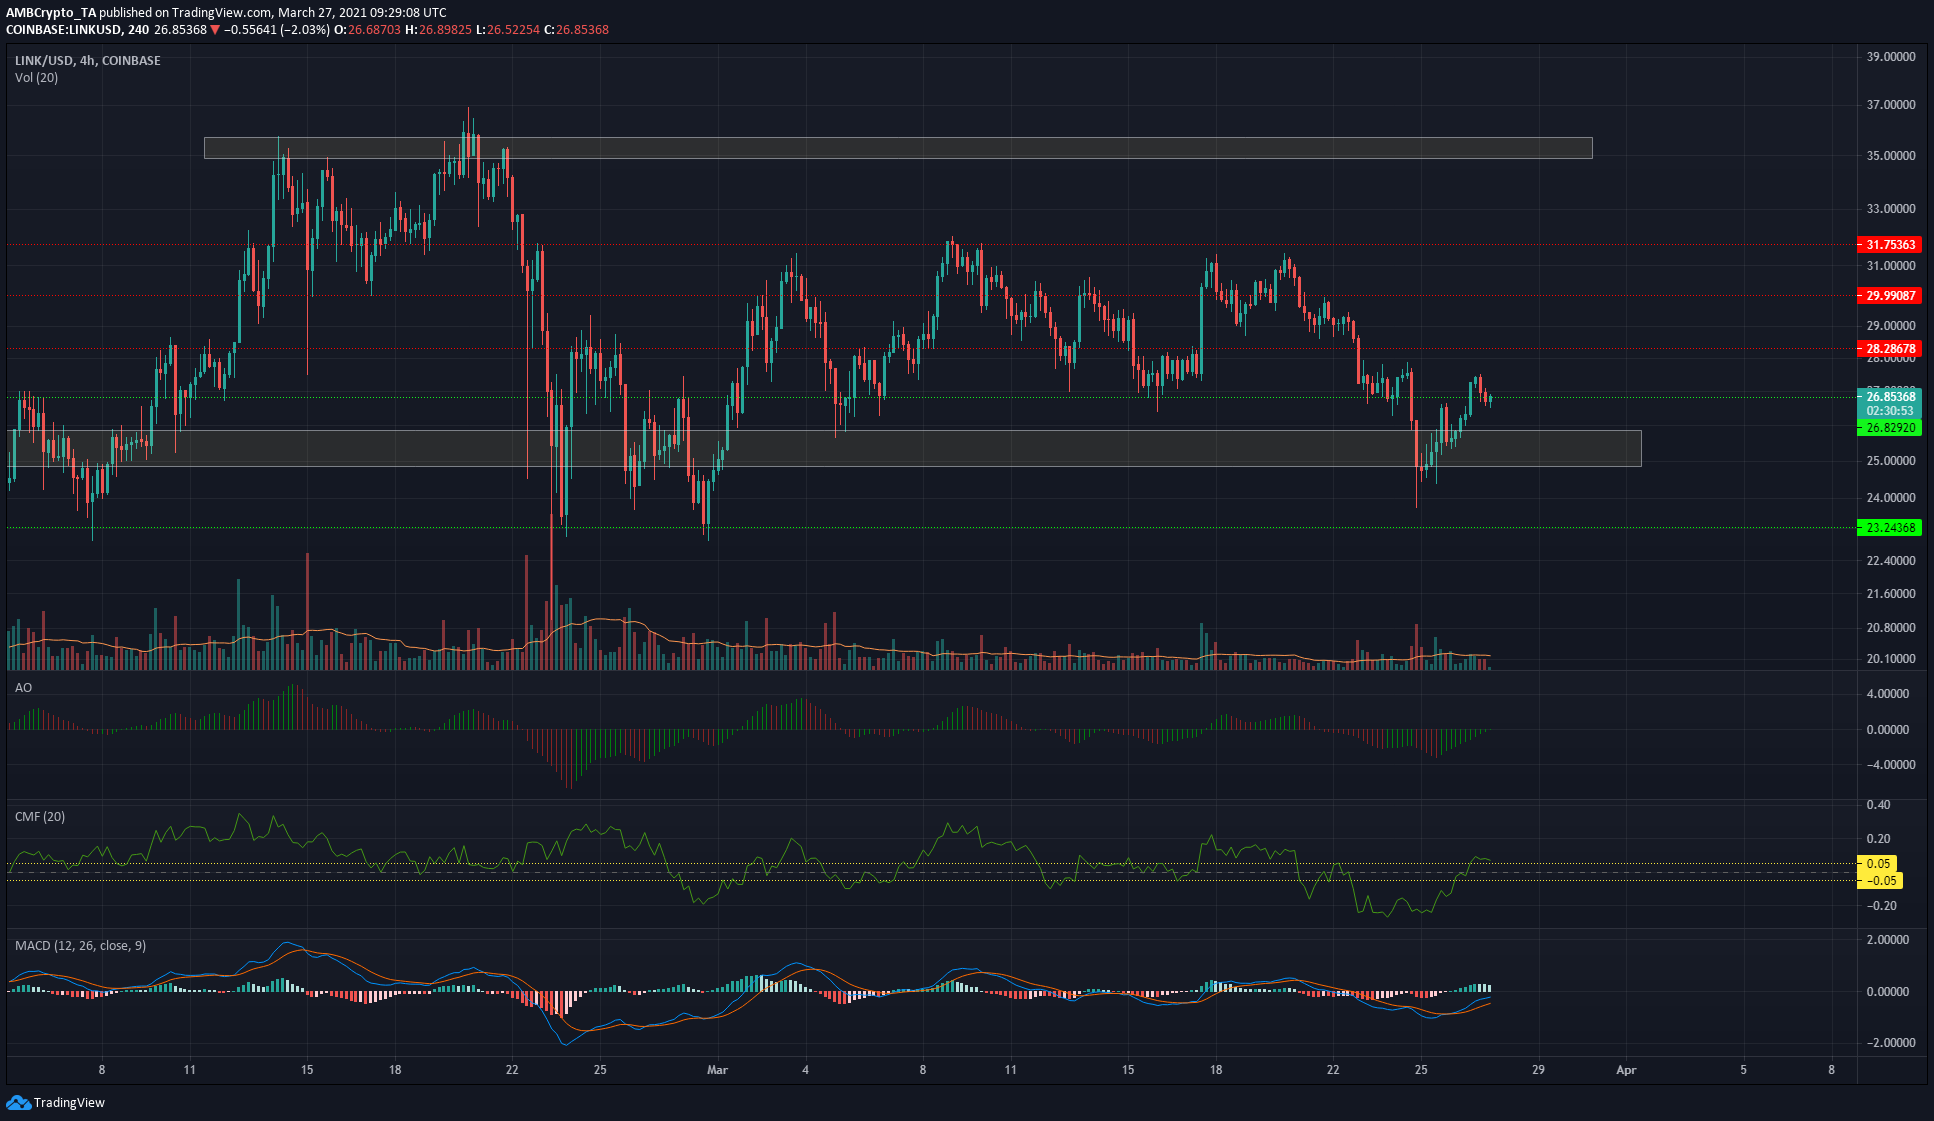
There was no real trend for LINK in the longer-term perspective. Since late February, LINK has ranged between the $23-$31 levels for the most part. However, this does not imply a lack of trading opportunities.
LINK climbed back above the $24.8-$25.8 area of demand and at the time of writing was looking to flip the $26.8 level to support. On lower timeframes, momentum was shifting toward bullish favor, and a move higher off $26.7-$26.8 was likely to play out.
CMF climbed above +0.05 to show capital flow into the markets, and MACD was climbing back toward the zero line to show weakening bearish strength.
Filecoin [FIL]
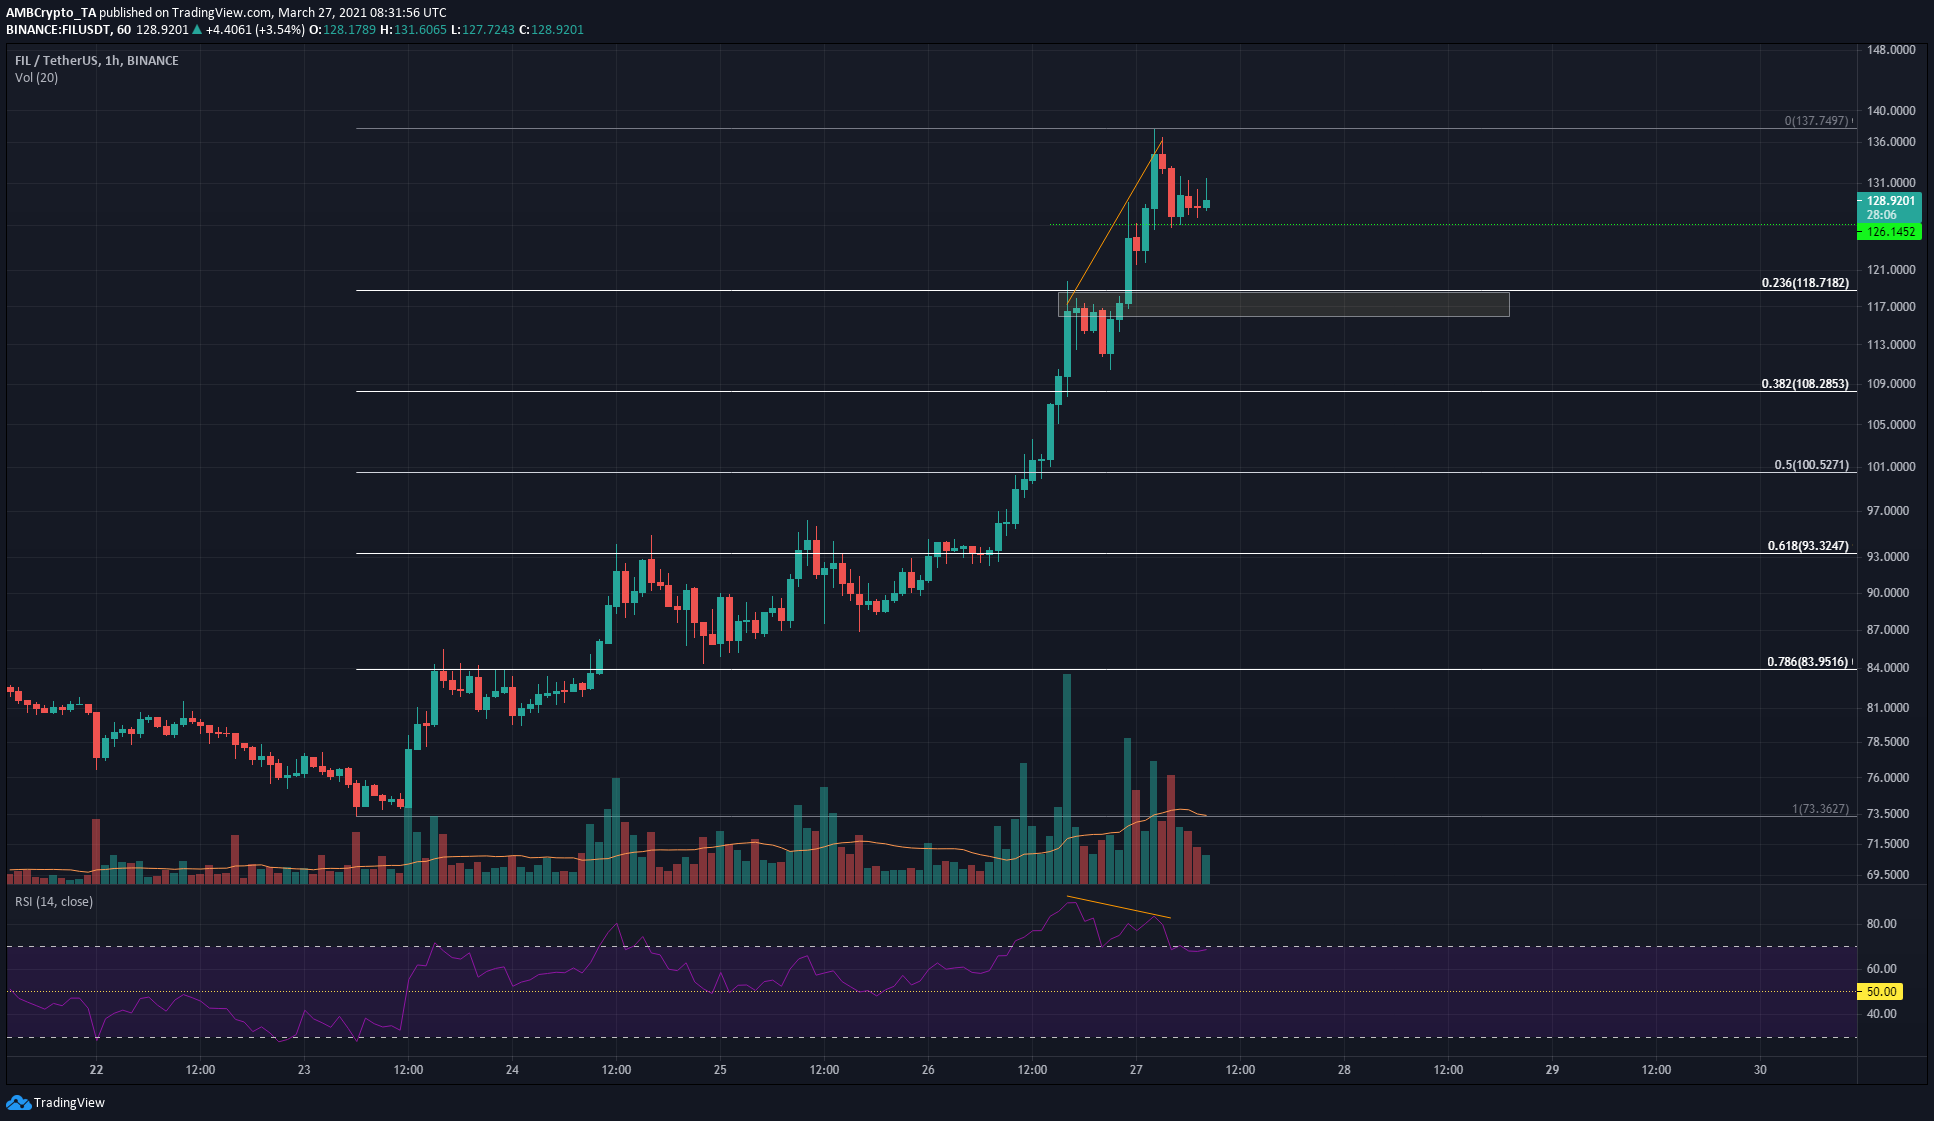
On the hourly chart, there was a bearish divergence between the price and momentum, highlighted in orange. This could see FIL pull back to the region of demand at $117, which would offer a buying opportunity.
A deeper pullback cannot be discounted, but divergences don’t necessarily play out. Hence, a revisit to $126 and $117 can be used to scale into a long position, and a move above the highs at $137 would set a 27% extension target of $163.
Descending beneath $108 could be a sign of bulls losing momentum, and $100 and $93 would be levels of interest to buyers. The longer timeframes do not yet show a divergence, and FIL likely has further upside past $137.


