Stellar Lumens, Ethereum Classic, Aave Price Analysis: 15 March

Despite the sideways trading of the past week across the market, it appeared that Stellar Lumens and Ethereum Classic could be gearing up for a strong move to the upside in the near term. Aave has been stuck within a range, but nevertheless offered trading opportunities.
Stellar Lumens (XLM)
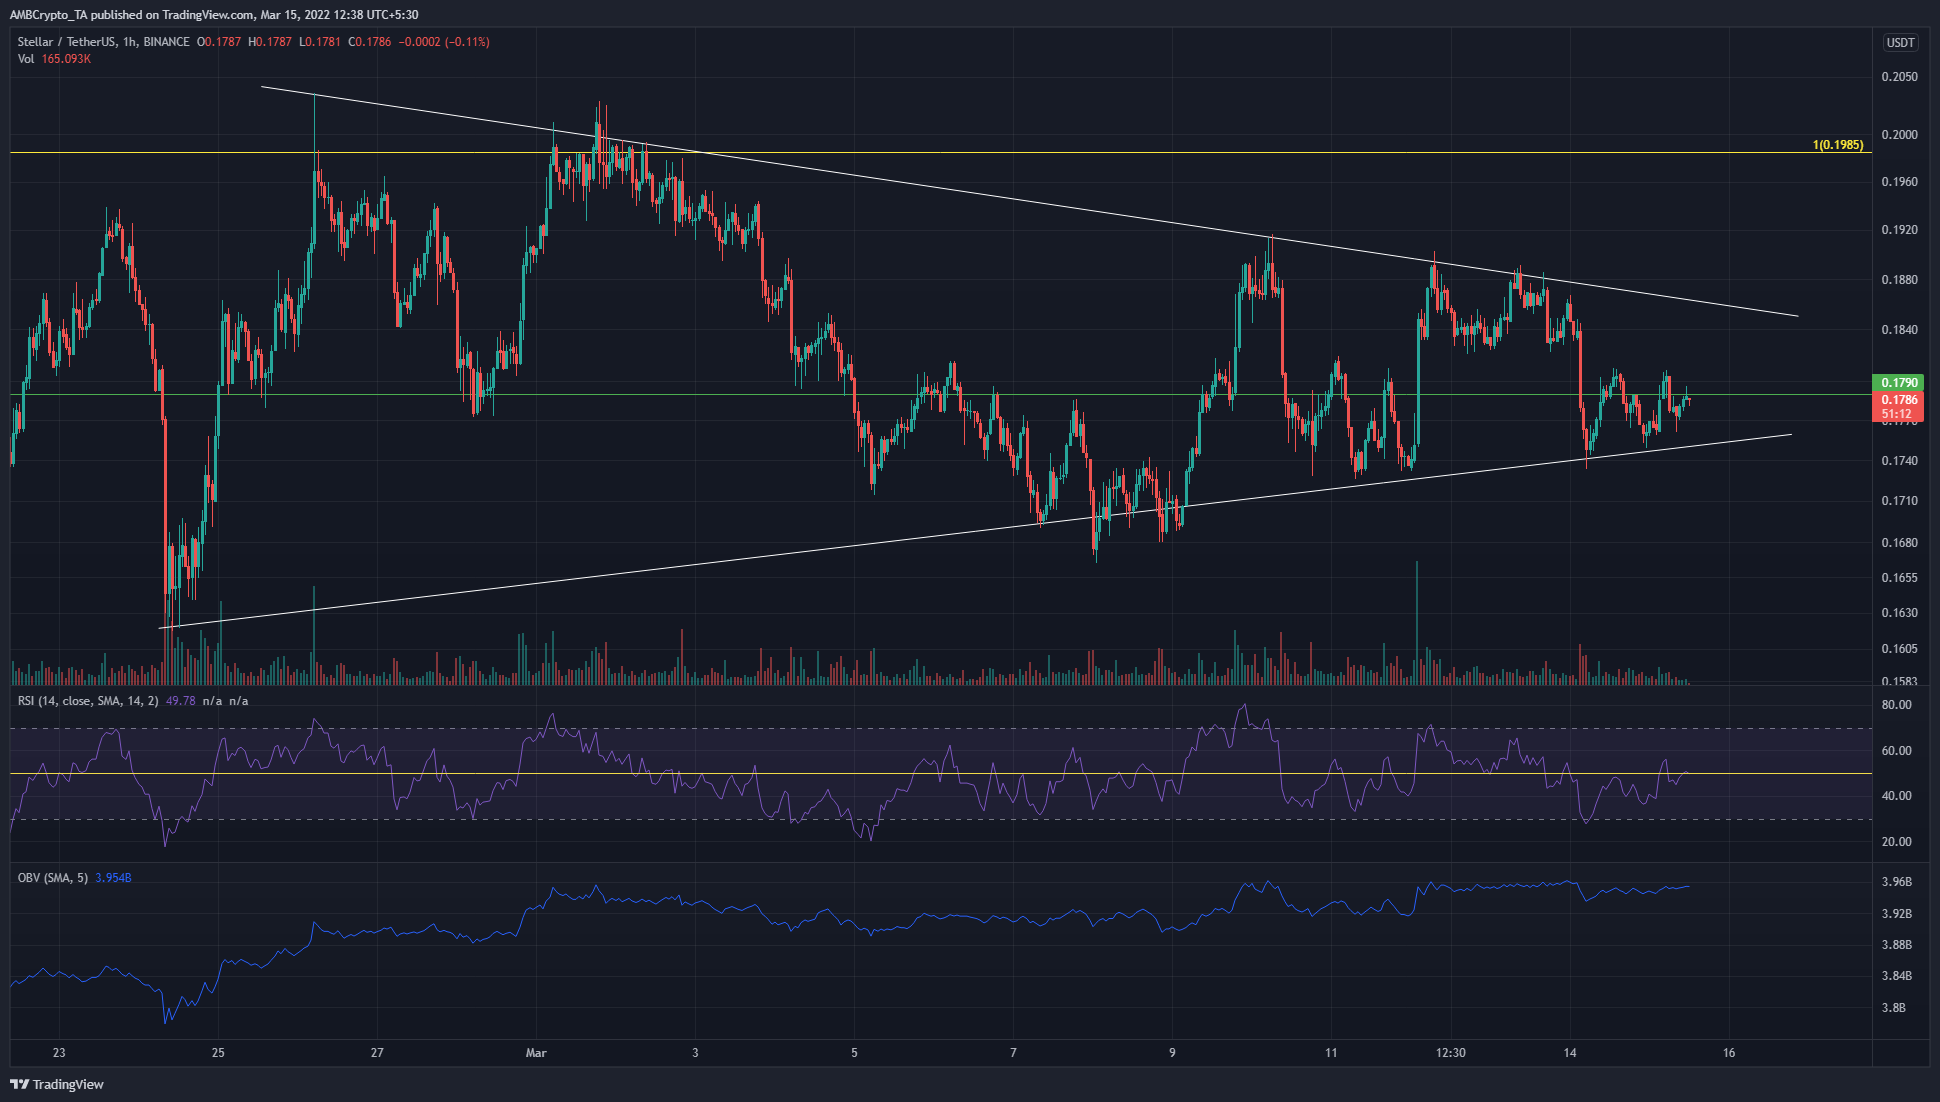
Stellar Lumens has formed higher lows in the past three weeks- but has also registered lower highs (white). This kind of compressive price action indicated a spring was being wound, and a breakout was imminent. A session close above $0.188 or below $0.174 would be needed to confirm the next move’s direction.
The OBV has been climbing higher as well, which meant buying pressure has been steady. Therefore a bullish breakout was likely. The RSI stood at neutral 49.8 and did not exhibit any divergences to act upon in the short term.
Ethereum Classic (ETC)
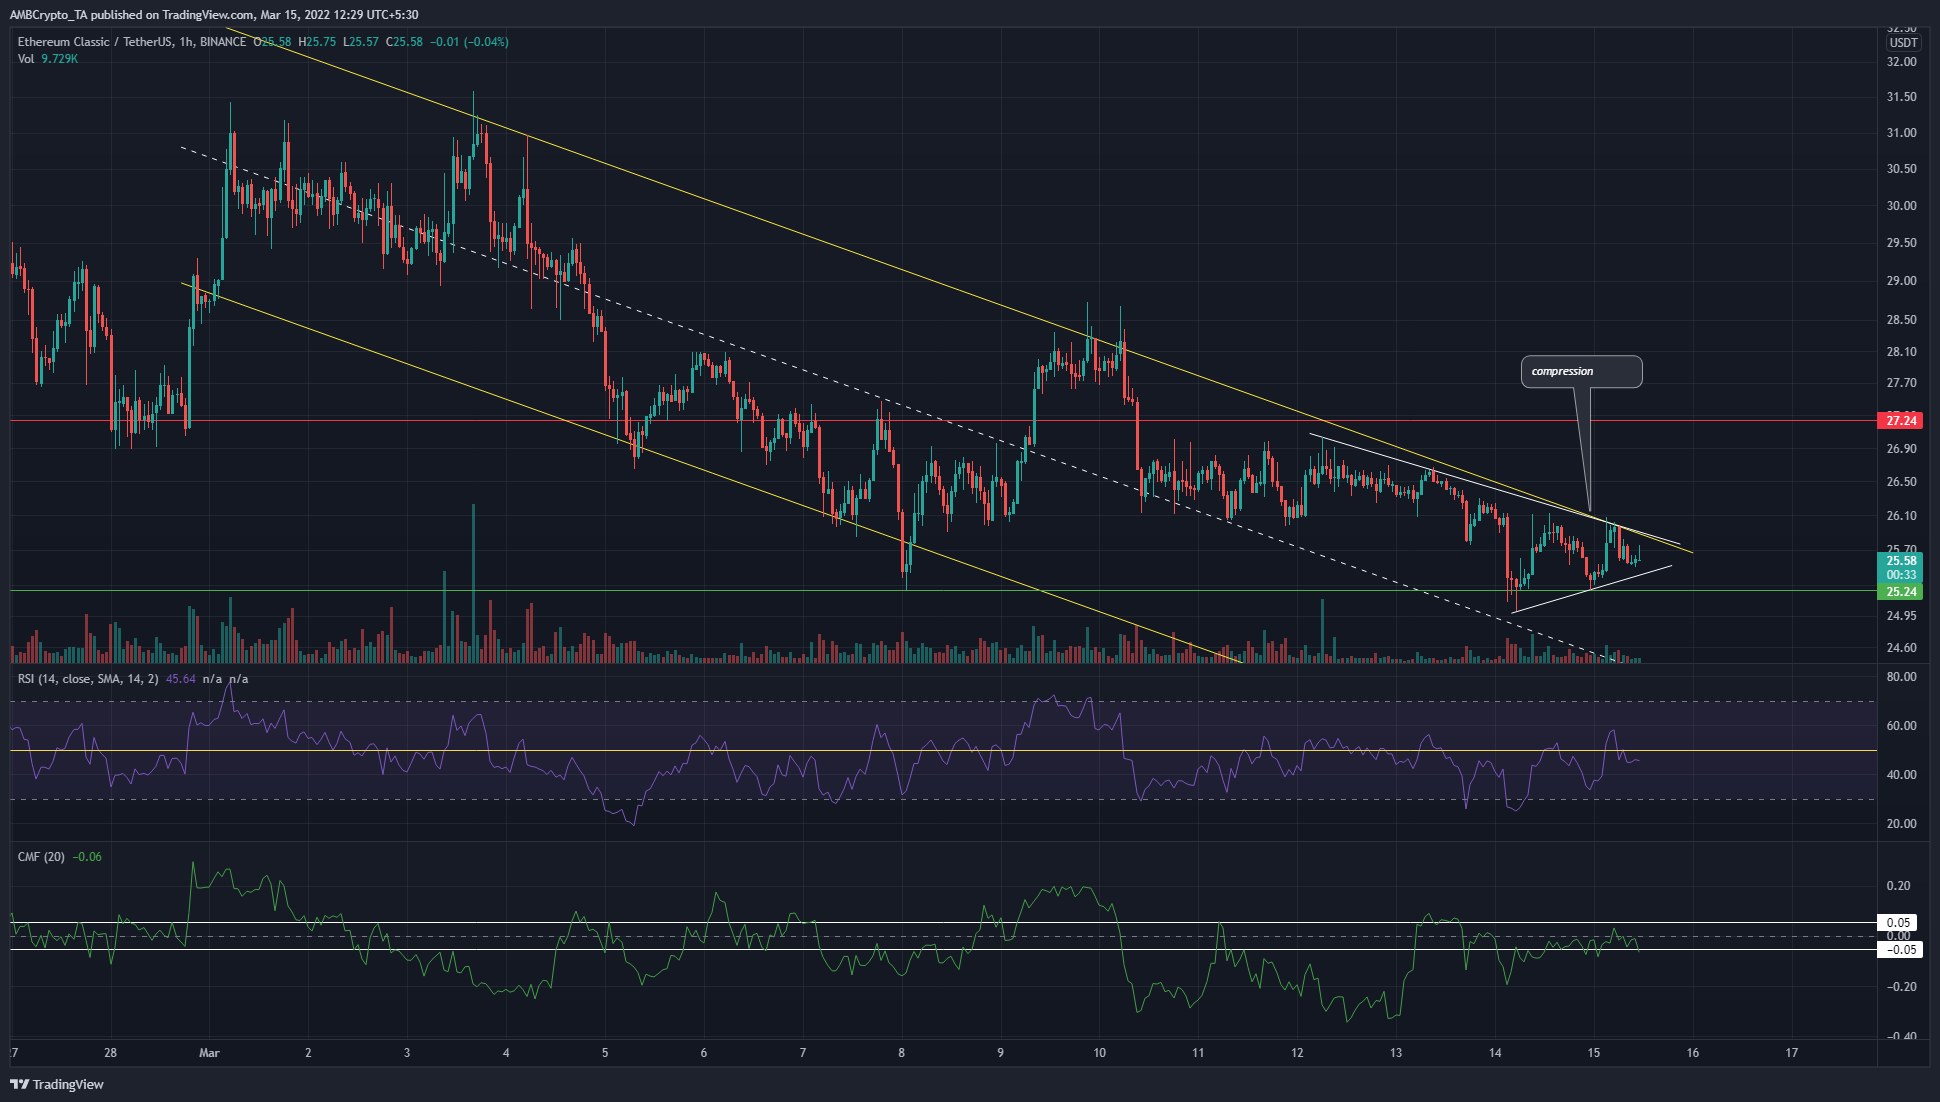
Ethereum Classic has been trading within a descending channel (yellow) since the start of the month. As of press time, the $25.24 support level had held firm. Moreover, the price has compressed in the past 24 hours (white), just beneath the channel’s upper boundary. This could see the price break out to the upside, or face rejection at the channel’s upper boundary and move beneath $25.24.
However the indicators did not yet show a breakout in the making- they indicated neutrality. The CMF did not show significant capital flow into or out of the market, while the RSI stood at 45.6.
Aave (AAVE)
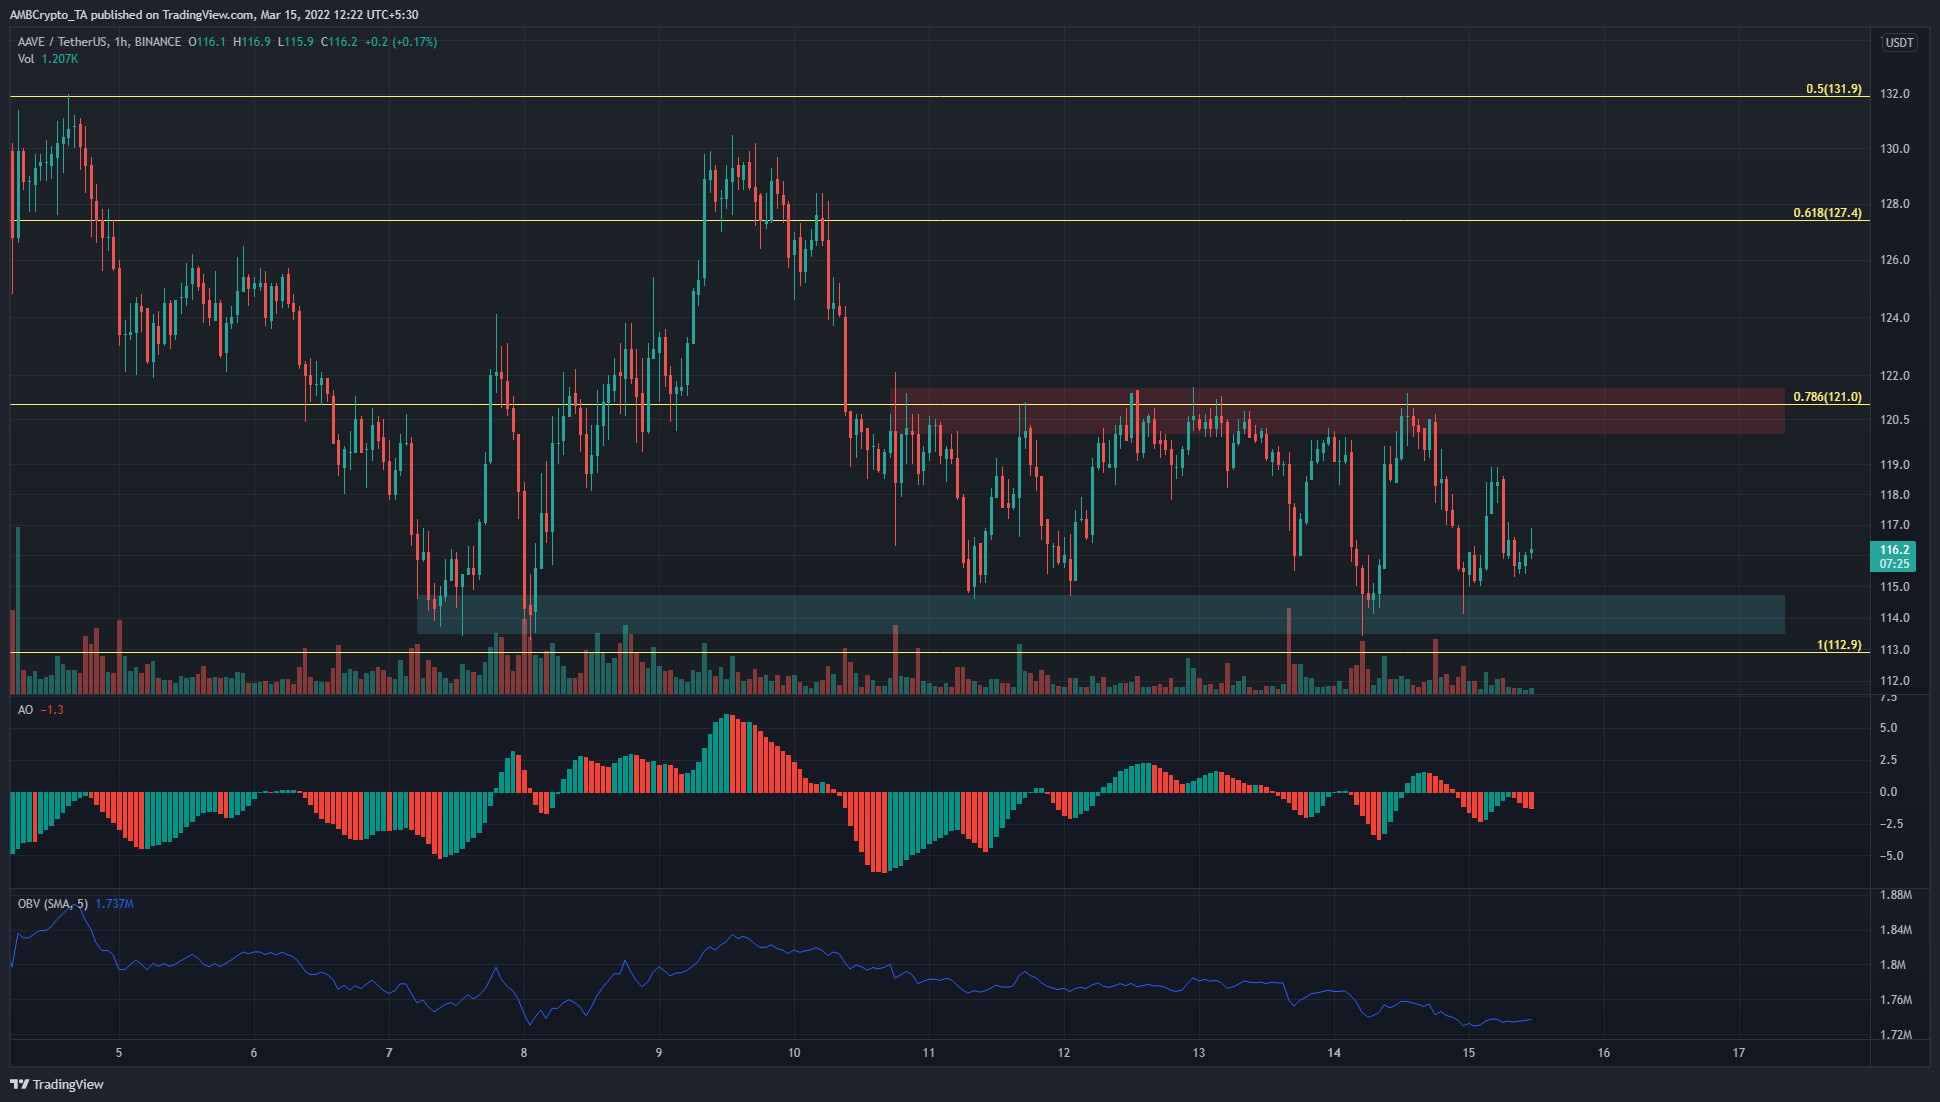
AAVE has been trading between $114.5 and $121 in the past week. This amounts to a little more than a 5.5% swing in the other direction at the range lows and highs, which offered excellent trading opportunities for intraday traders.
The Fibonacci retracement levels (yellow) showed that $121 has significance and would need to be flipped to support for traders to ride to momentum upward. The OBV has slid lower in recent days- a sign that selling pressure had been higher in recent days. The Awesome Oscillator did not show momentum favoring either side.


