
Stellar Lumens seemed to be moving rangebound between $0.40 and $0.38 with low volatility. SUSHI could reverse its downtrend if the bulls recapture the $19.2-level. Finally, Qtum tested the $7.39-resistance, while THETA could cool down from record levels.
Stellar Lumens [XLM]
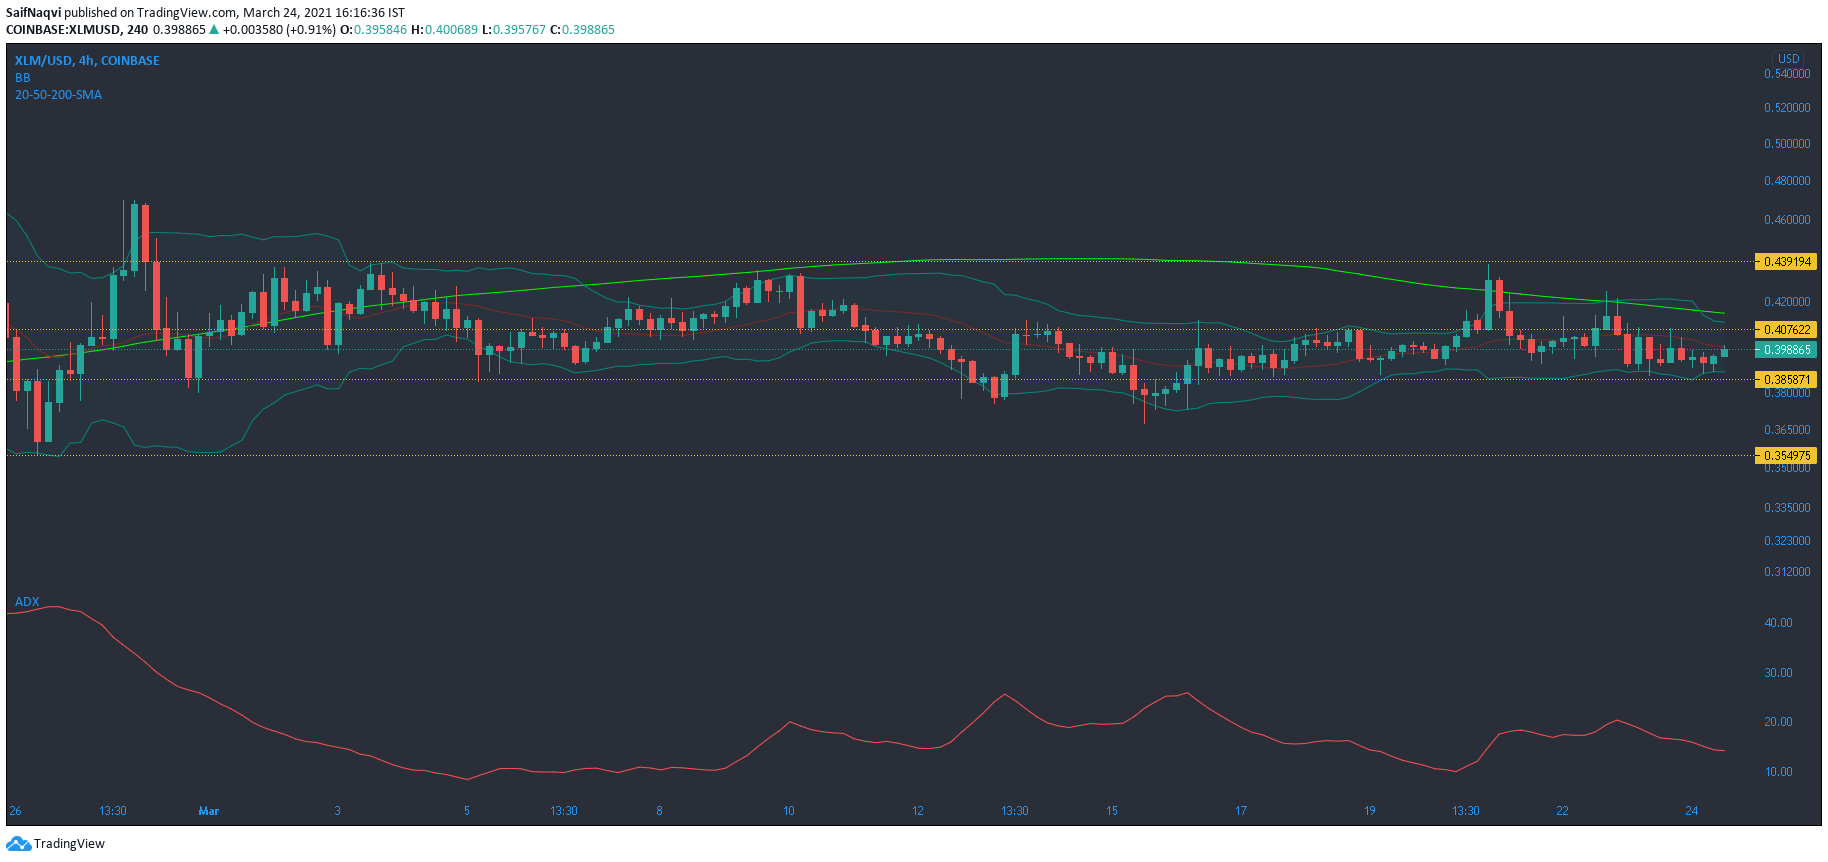
Source: XLM/USD, TradingView
Losses over the month amounted to 14% as Stellar Lumens reflected a subdued market since its drop towards the $0.354-support. The Bollinger Bands highlighted low volatility as the price traded between $0.40 and $0.38. While breakouts have been witnessed on either side of the channel, the opposing side has been quick to negate it. In fact, lower volatility disallowed huge price swings to the upside, especially since the candlesticks were moving below the 200-SMA (green).
Meanwhile, the ADX Indicator noted a reading of 14 and suggested a weak trend in the market. A spike in the 24-hour trading volume would be the first signal of an incoming bullish move.
SushiSwap [SUSHI]
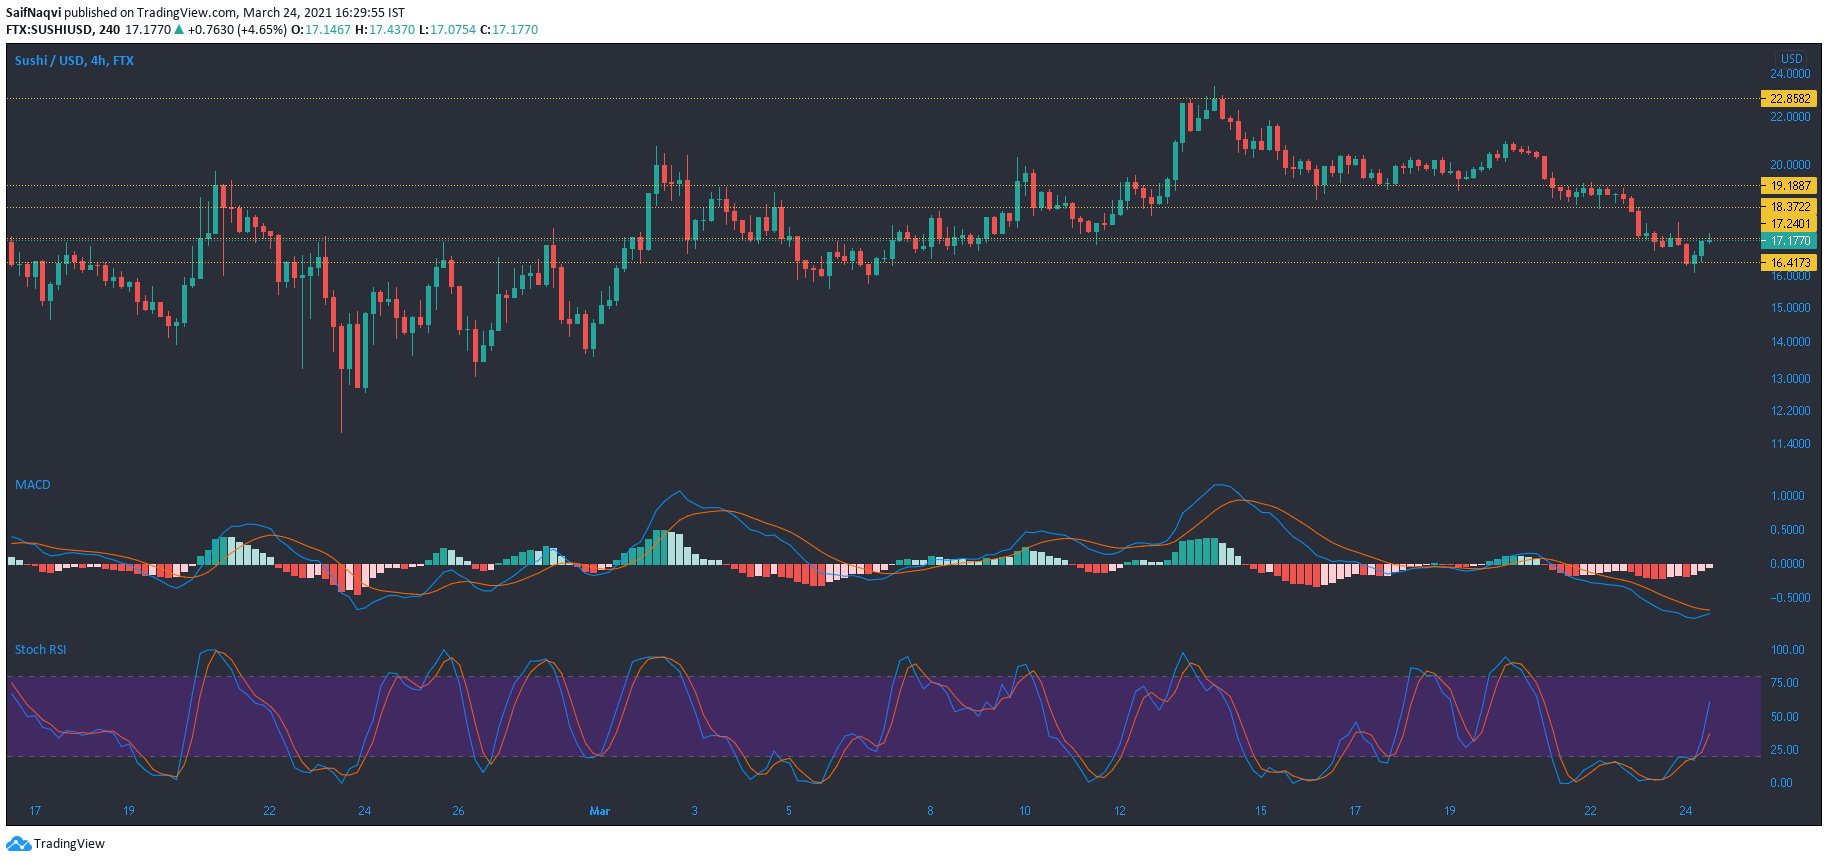
Source: SUSHI/USD, TradingView
One of the better performers of 2021 so far, SUSHI showed some exhaustion from record levels. A downtrend was visible on the 4-hour chart after the price moved from a record high of $23.4 to a low of $16.1. However, the support at the press time level cushioned additional losses and bullish movement was seen over the last few sessions.
To mark the end of a downtrend, the bulls would need to scale above multiple targets. The first target lay at its immediate overhead resistance and the second resided at the $19.2-upper ceiling. A bullish crossover in the MACD could be a stepping stone in order for the bulls to achieve their short-term goals.
The Stochastic RSI was in the neutral zone, but was pointing north from equilibrium.
Qtum [QTUM]

Source: QTUM/USD, TradingView
Bullish price action over the last 24 hours saw Qtum test its overhead resistance at $7.39. The hike was backed by a pick-up in trading volumes as well, which clocked in at over $600 million. Strong volumes would enable the price to break upwards on the charts and into a region that was last seen over 40 days ago.
The RSI was yet to reach its tipping point in the overbought region, and its trajectory signaled additional gains for the crypto-asset. A breakout above its press time resistance would likely see the price hike towards the $8-mark. However, that could require strong bullish momentum, and the Awesome Oscillator would need to continue its ascent above the half-line.
THETA
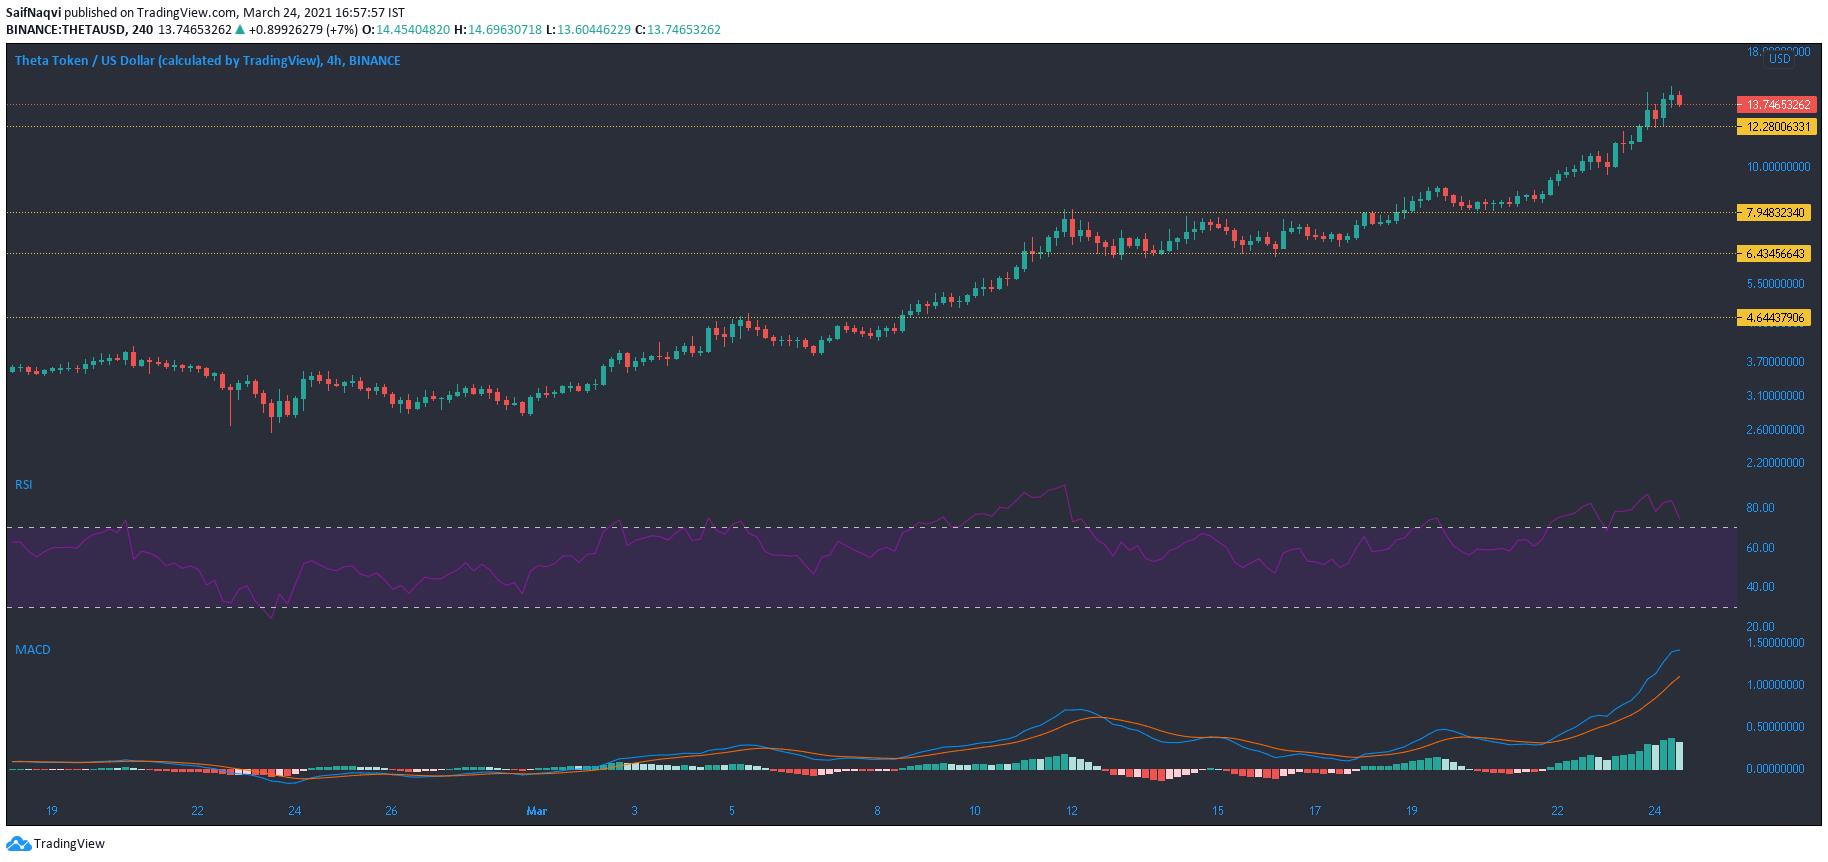
Source: THETA/USD, TradingView
Gains over the first three months of 2021 amounted to over 600% as THETA jumped on the crypto-rankings and moved into the top-10. Ranked ninth, at the time of writing, with a market cap of $14.1 Billion, THETA was trading at a record high of over $14.
However, the on-chain metrics did point to saturated conditions in its market. The RSI showed a high concentration of buyers, which saw the index reverse direction. The MACD line continued to move above the Signal line, but the histogram noted weakening momentum. A pullback was possible at $13 or even at $12, and stabilization would lead to more gains over the coming sessions.
While the recent surge in the popularity of NFTs such as THETA has been hard to miss, those buying the tokens with Bitcoin and Ethereum may be taxed.