Stellar Lumens, Synthetix, Loopring Price Analysis: 06 January

Synthetix and Loopring followed market frontrunners Bitcoin and Ethereum‘s suit by surging on the price charts, before minor corrections halted their movements. On the contrary, Stellar Lumens was having a field day on the charts, with more upside projected in the short-term.
Stellar Lumens [XLM]
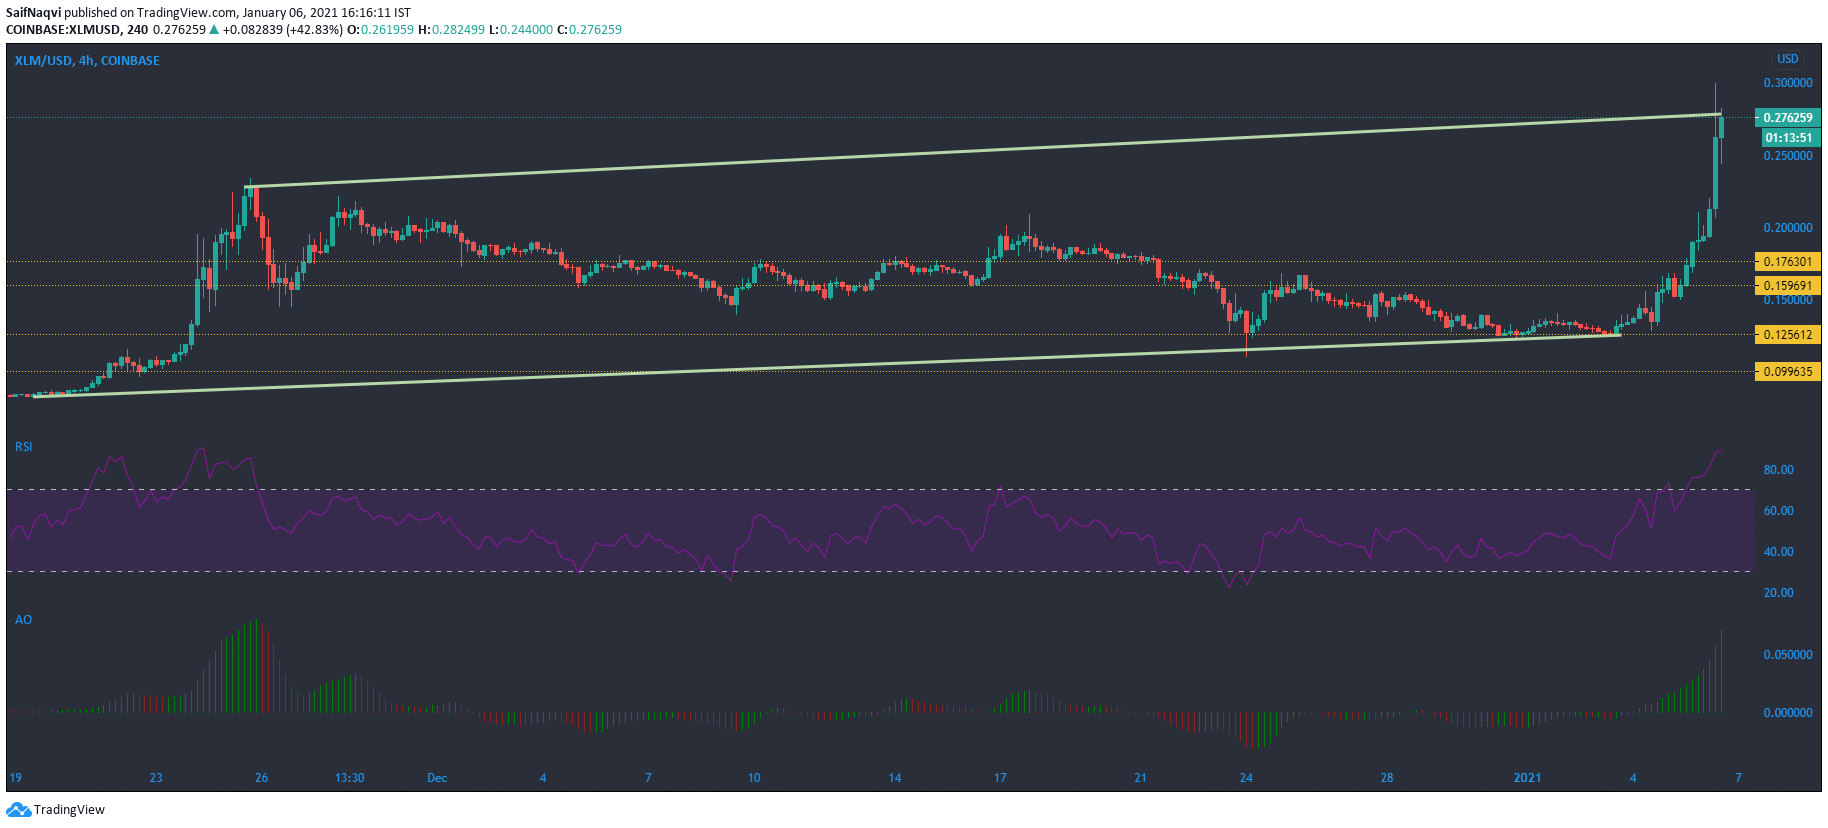
Stellar Lumens has been outperforming on the charts ever since Ukraine’s government announced that it had chosen the Stellar network to build a central bank digital currency. The cross-border transactions platform Stellar and its native token Lumens could potentially gain a lot of exposure from this arrangement, especially since Ukraine ranks among the top three countries in the world for cryptocurrency adoption, according to a report by Chainalysis.
The deal pushed XLM by over 96% in the last two days, while the price climbed to a high of $0.30. The indicators suggested that strong buying behavior could push the price to newer levels in the near future.
The Awesome Oscillator’s green bars were rising above equilibrium, a sign of bullish momentum increasing.
The Relative Strength Index was in the overbought zone but registered a slight downwards movement. This suggested that a correction could hit XLM if the price moves towards the oversold territory. The support at $0.176 could offer some relief if the price does move south.
Synthetix [SNX]
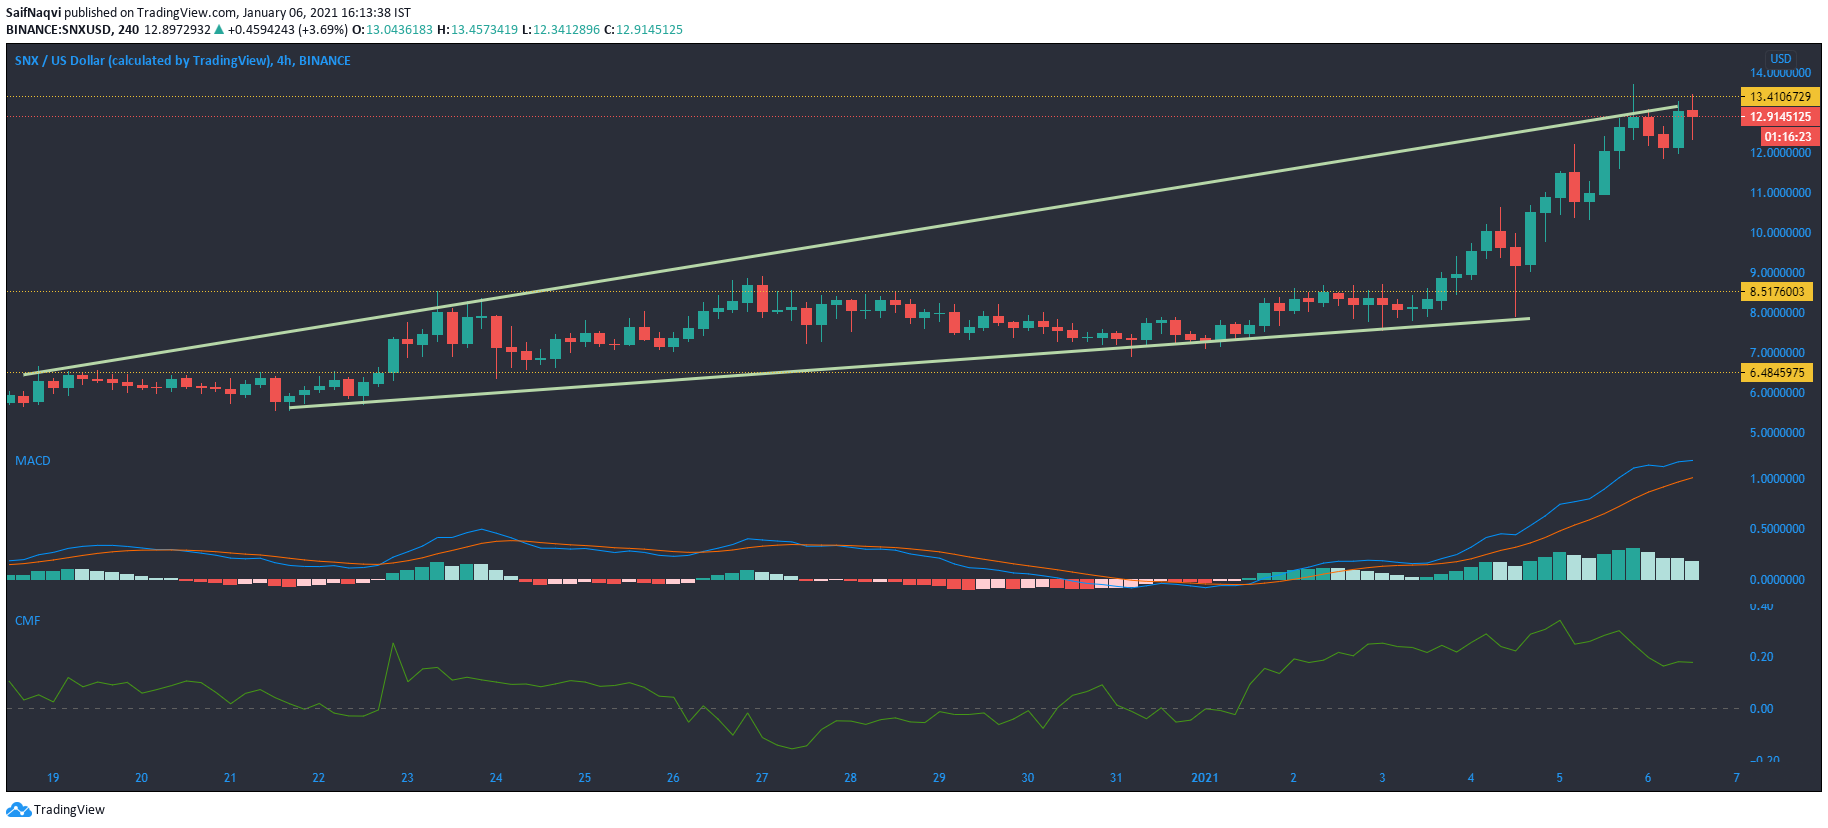
SNX surged to record levels just yesterday after the cryptocurrency traded at $13.7. Possibly backed by Ethereum’s latest price surge, SNX has been rising steadily for the past three days since buying pressure ramped up prices. At the time of writing, SNX was trading close to its resistance at $13.41, and the indicators suggested a bit of sideways movement for the crypto-asset.
The MACD’s fast-moving line registered a slight downtick towards the signal line. The histogram also noted a fall in bullish movement as the bars fell towards zero.
The Chaikin Money Flow highlighted a fall in capital inflows, when compared to the last few sessions.
Loopring [LRC]

While Loopring’s price shot upwards at the start of the year along with market leaders Bitcoin and Ethereum, a minor pullback was witnessed on the charts over the past few trading sessions. The crypto’s price stalled and moved lower after testing the resistance at $0.579 as the sellers sought control of the prices. Moving forward, the price could head towards the support at $0.342 if the selling pressure continues to be a drag on prices.
The Bollinger Bands indicator noted a high degree of volatility in LRC’s price. Even though the candlesticks were trading on the upper band a few sessions back, a reversal might not take place till the prices trade below the middle band.
The Parabolic SAR’s dotted markers were placed above the candlesticks, suggesting the prices were indeed bearish.


