Stellar Lumens: Traders can long at this ‘ideal’ entry point

Stellar Lumens has had a phenomenal start to October. A near 66% run up to a local high of $0.0417 was responsive at important Fibonacci levels, which allowed for healthy price progression. Another buy opportunity was at the table as XLM approached the confluence of 50-SMA (yellow) and the 61.8% Fibonacci level.
An upwards push from this confluence can allow XLM to maintain its streak of higher highs and topple levels seen during September’s bull run. At the time of writing, XLM traded at $0.372, down by 3.4% over the last 24 hours.
XLM Daily Chart
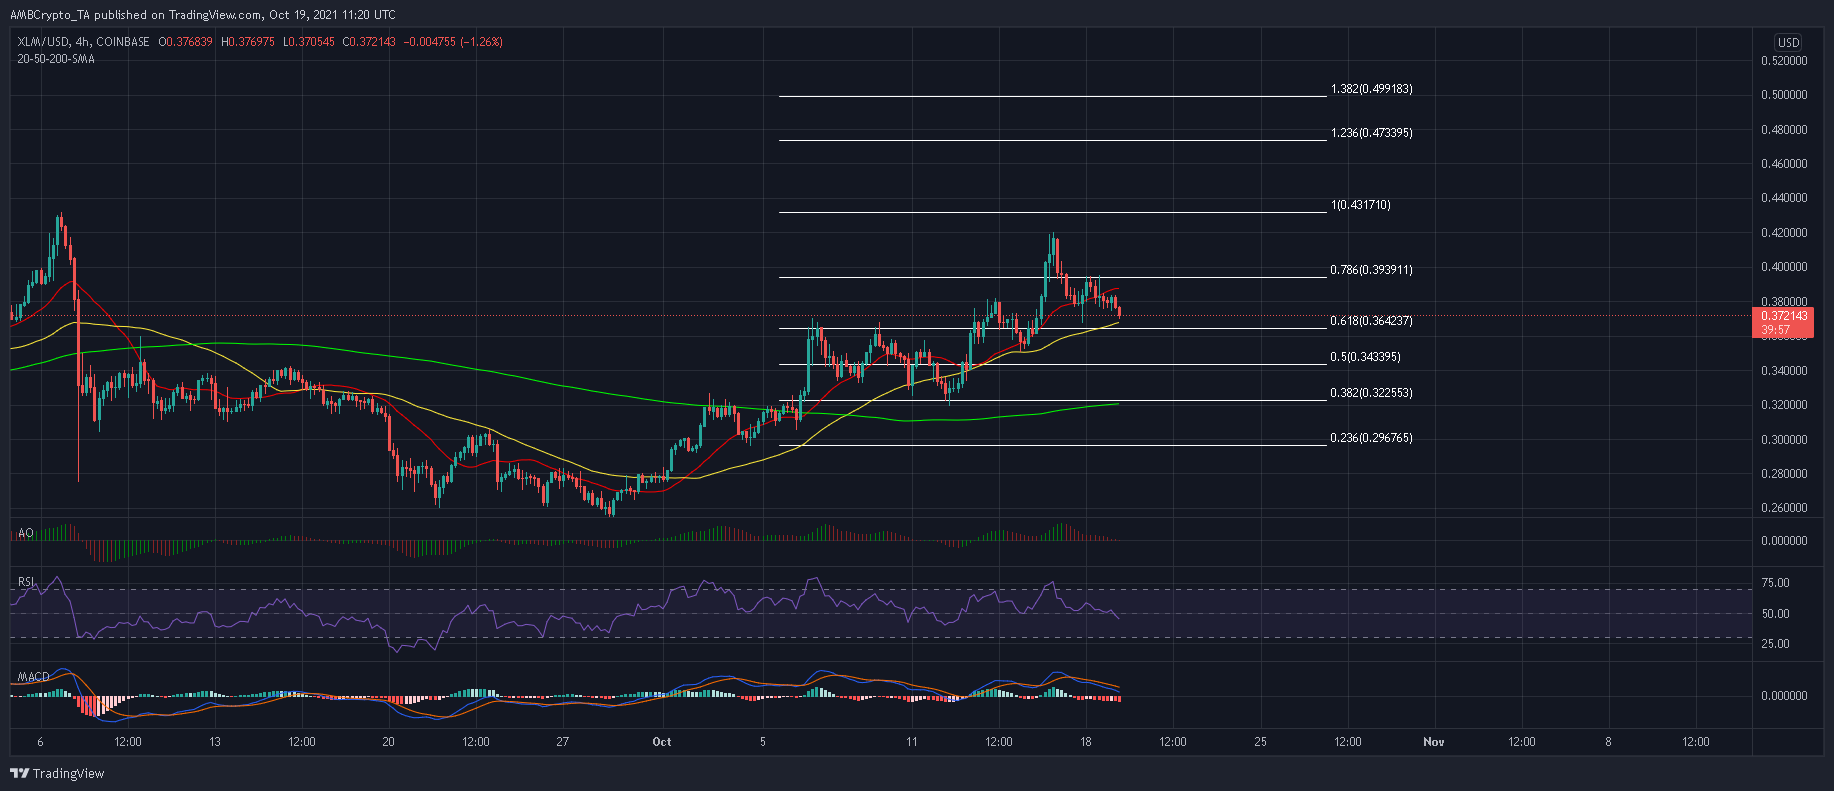
Currently trading at a 13% discount when compared to its October local high of $0.0417, XLM was on the hunt for an attractive price level to commence its next upcycle. Now the combination of the 4-hour 50-SMA (yellow), which has triggered a rebound during XLM’s present bull run, combined with the 61.8% Fibonacci level would be an ideal opportunity for bullish traders to jump on board.
In case this defense in penetrated, support found anywhere above the 50% Fibonacci level would maintain XLM within a bullish-bias. However, a close below the 38.2% Fibonacci level and 200-SMA (green) could disrupt XLM’s market structure and expose the alt to further drawdowns.
Reasoning
Now XLM’s near-term indicators did present some near-term threats. The RSI, MACD and Awesome Oscillator threatened to close below each of their respective half-lines and generate some more selling pressure in the coming sessions.
However, such developments have not hurt XLM’s current run as bulls have hit back almost instantly at strong price levels. If this trend were to be maintained, XLM would face no hiccups in ascending to a new local high on the chart.
Conclusion
XLM was expected to rebound from the 61.8% Fibonacci and move to higher price points. The 123.6% and 138.2% Fibonacci levels could be XLM’s next destination if bulls are able to scrape past a double top at $0.431 with strong volumes to back their movement. Meanwhile, traders can long XLM between $$0.364-$0.360 to capitalize on the projected rally.


