Stellar Lumens, Waves, Compound Price Analysis: 28 December

The altcoin market recovered somewhat from its recent losses, with many altcoins noting a short-term bullish outlook. Stellar Lumens appeared poised to move above the $0.156-level, but Waves was unable to breach its level of resistance as it noted consistent selling pressure over the past few weeks. Finally, Compound seemed to be bouncing back from its recent losses.
Stellar Lumens [XLM]
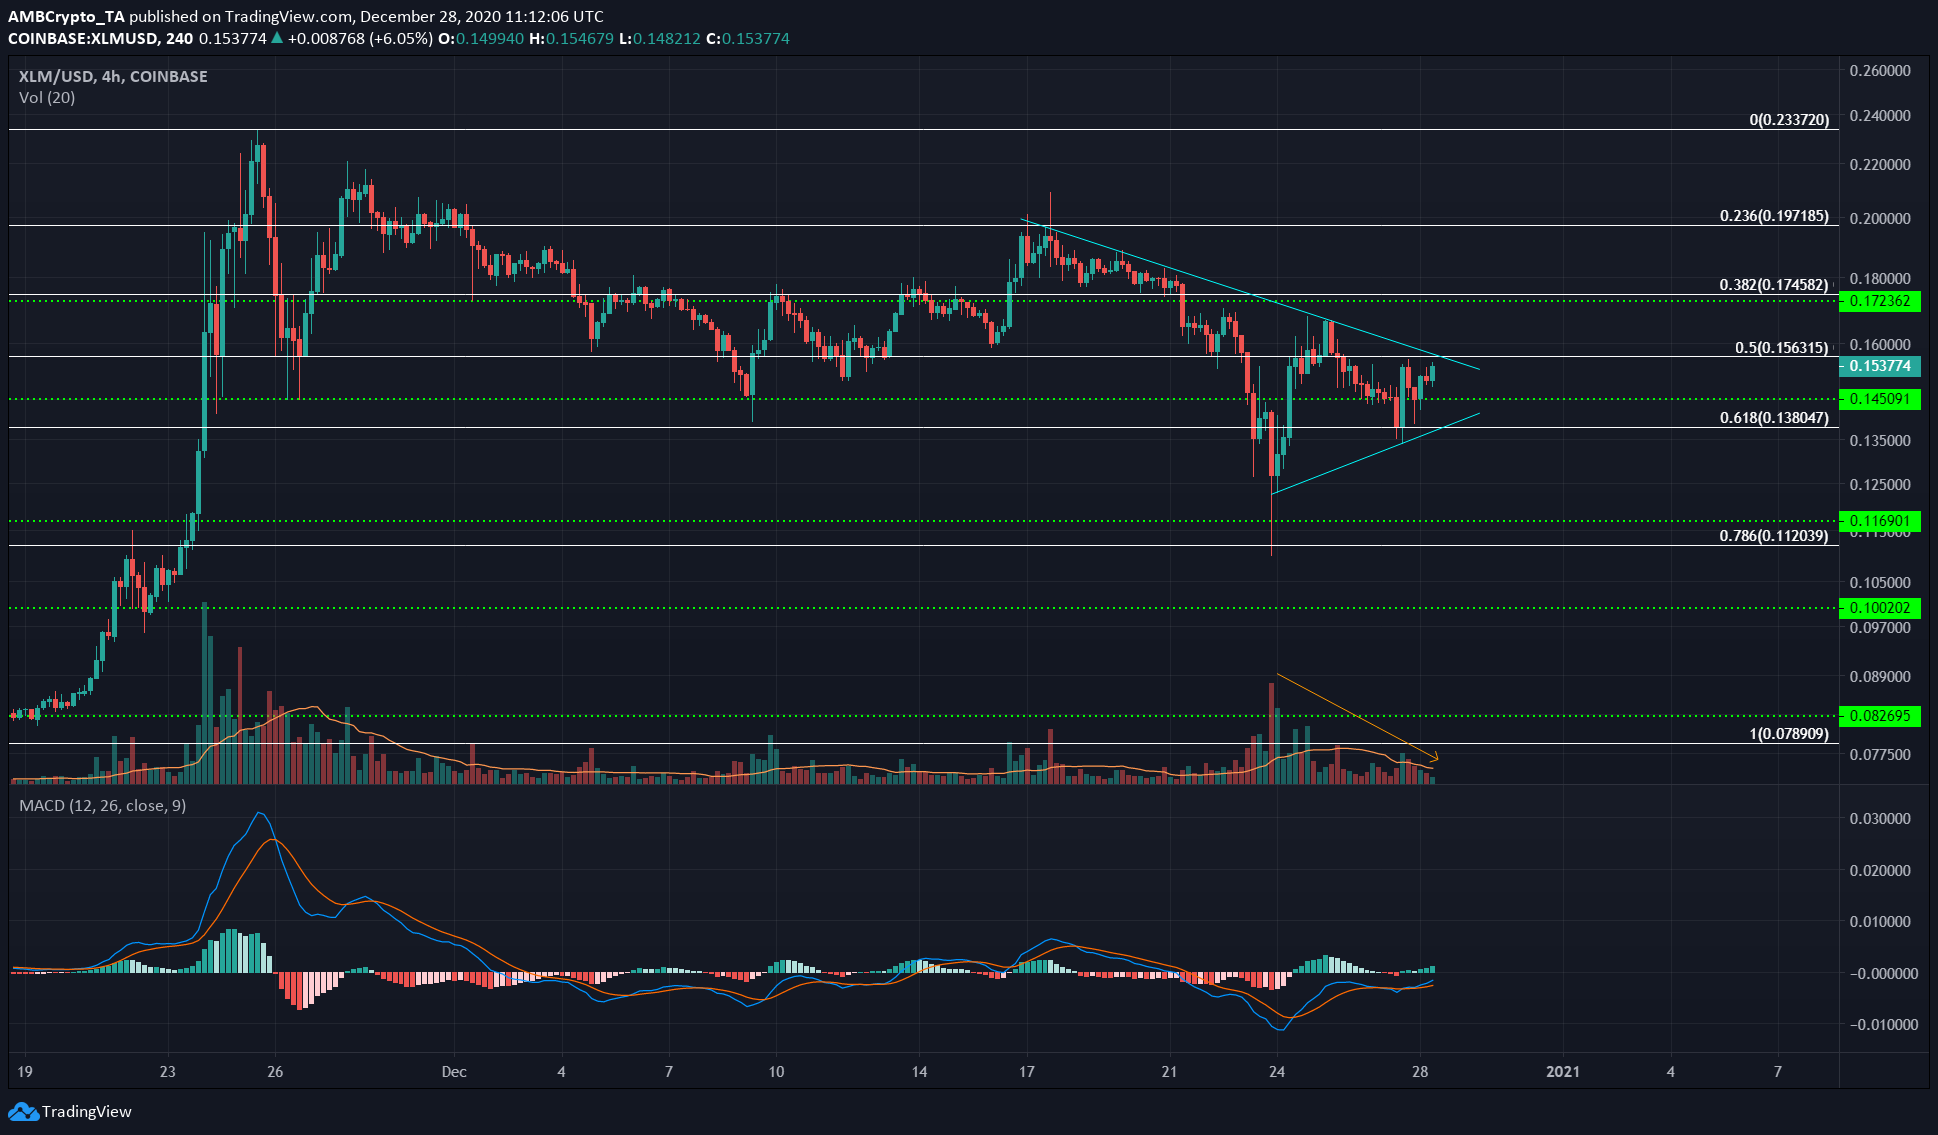
XLM formed a symmetrical triangle pattern (cyan) on the charts, with declining trading volume over the past few days. The 50% Fibonacci retracement level at $0.156 and the 61.8% retracement level at $0.138 can be expected to act as strong resistance and support levels.
The MACD was moving under the zero line and noted a lack of momentum for XLM over the past couple of days, while forming a bullish crossover, with the same likely to climb higher.
A trading session close above either level backed by increased trading volume would likely presage the next move’s direction for XLM.
Waves [WAVES]
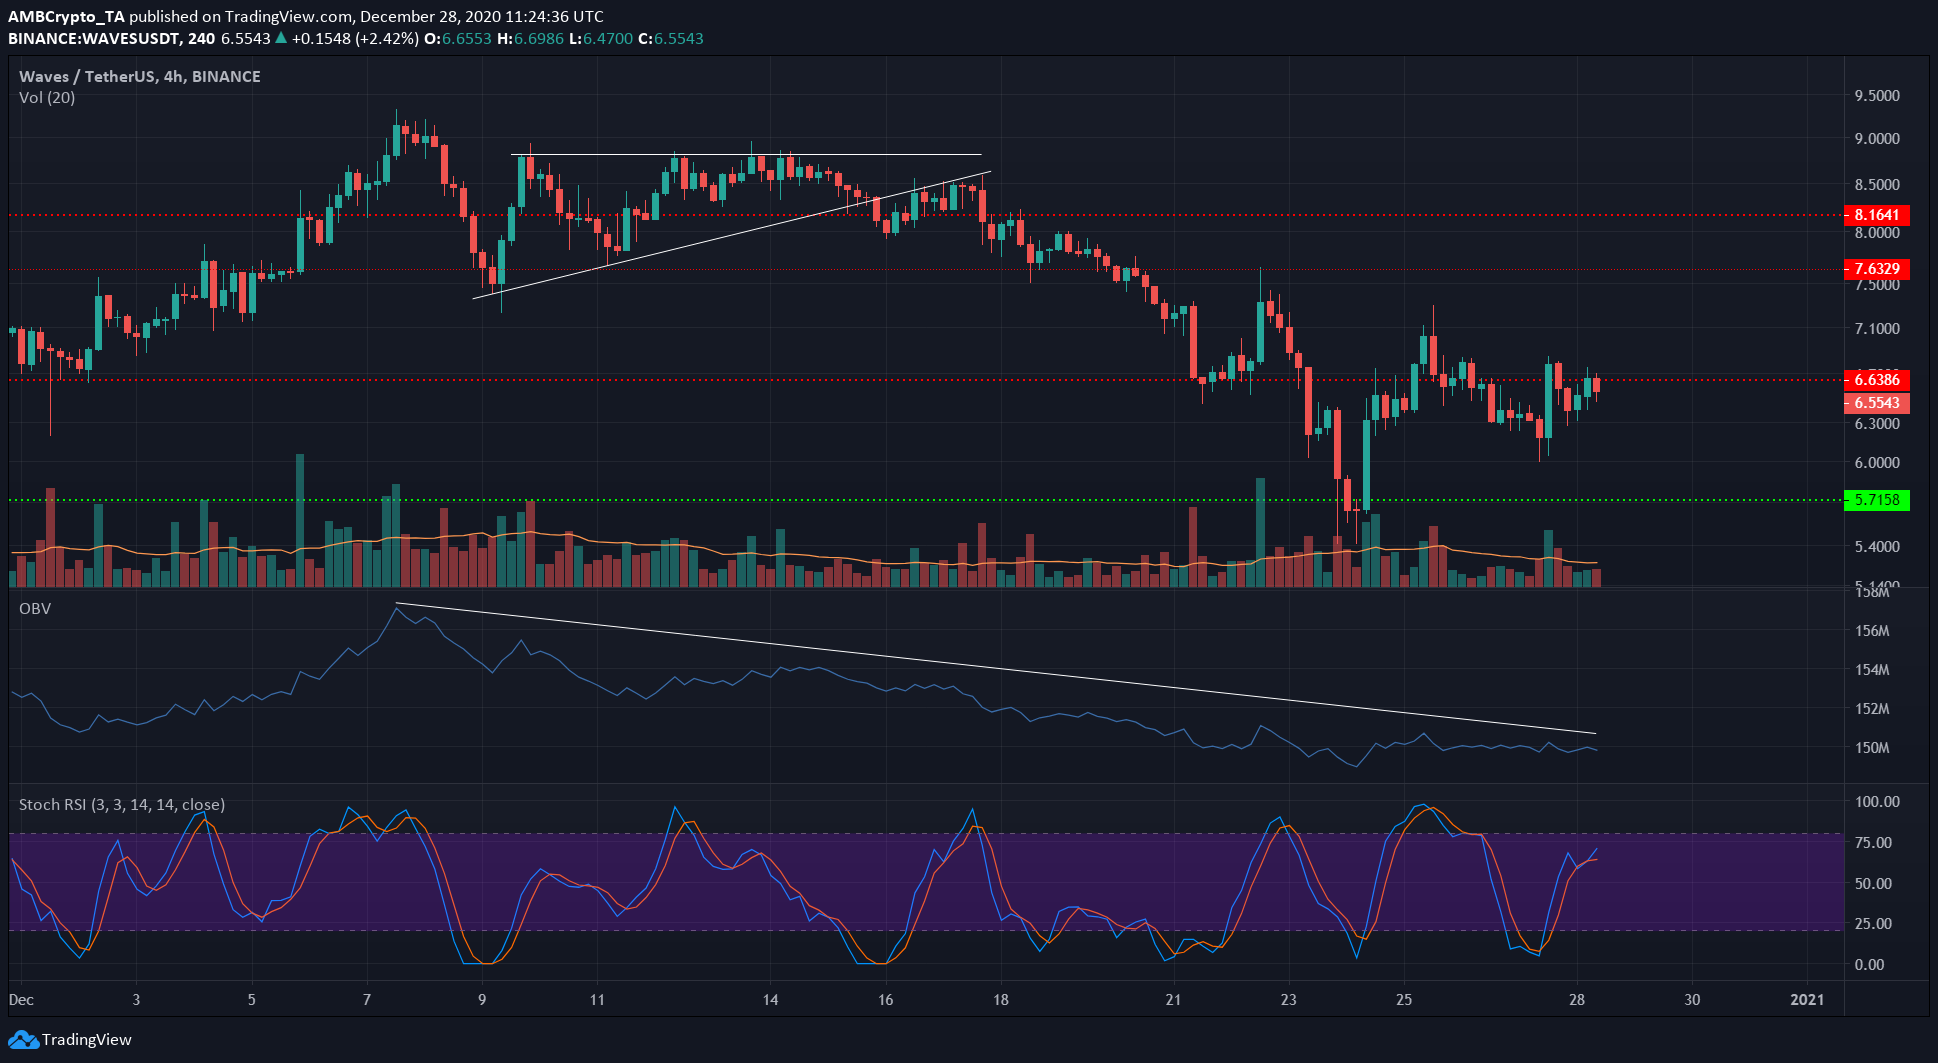
Over the past week, WAVES has lost the $6.6-level to the bears, bounced sharply off the $5.6-region, and attempted, in vain, to reclaim the $6.6-level from bearish hands.
The price stalled and slipped back under the level to test it as a resistance. Further, the OBV highlighted the consistent selling volume behind WAVES over the past three weeks.
Finally, the Stochastic RSI could climb into the overbought zone in the next few hours, with the same, accompanied by a continued lack of buyer interest, likely to point to a decline in price.
Compound [COMP]
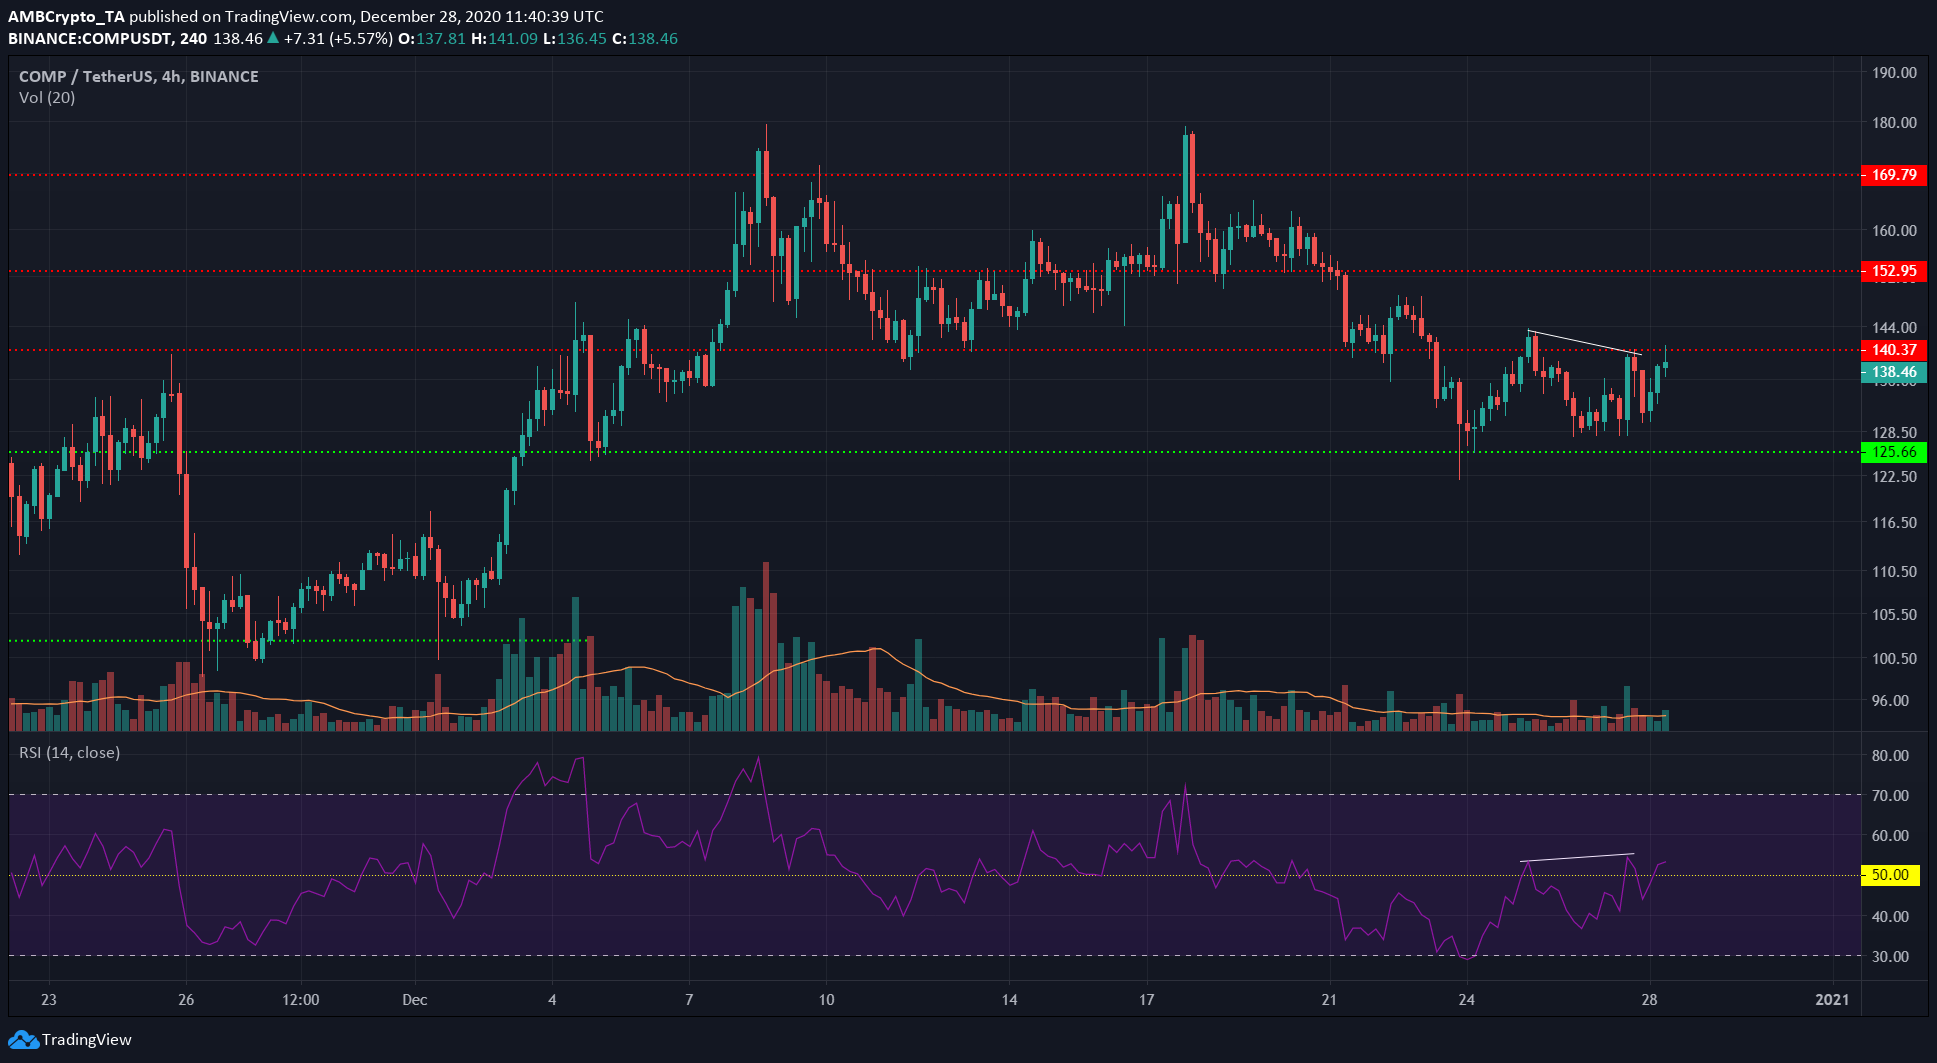
COMP registered a hidden bearish divergence between the price and the momentum a few hours prior to the time of writing, and subsequently lost 5.8% of its value. However, it rebounded quickly to retest the $140-level of resistance once more.
The RSI climbed above the neutral 50-line after two weeks under it, and a re-test of the same would underline the short-term nature of the ensuing uptrend.
Since the trading volume has not been stellar over the past couple of weeks, it indicated that the market was gearing up for its next major move.
A trading session close above $140 backed by strong volume could initiate a rally for COMP, in light of the bullish sentiment behind alts in the wake of a surging ETH.


