Stellar [XLM] price prediction: Assessing odds of a rally to $0.40
XLM is showing signs of recovery, but resistance at $0.360 remains a hurdle. Will technical indicators support a breakout?

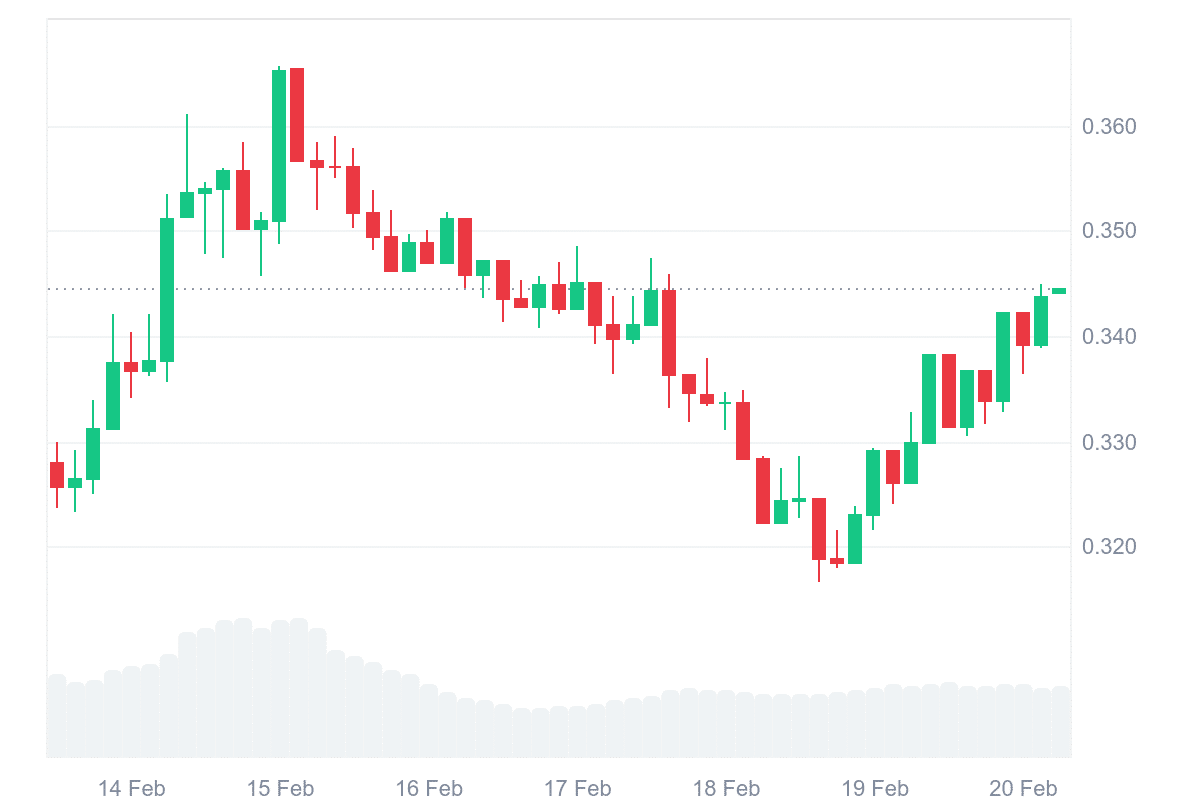
- XLM was trading at $0.344, at press time, showing early signs of recovery.
- The 50-day and 200-day Moving Average (MA) crossover suggested potential trend shifts.
At the time of writing, Stellar [XLM] was trading at $0.344, showing early signs of recovery.
The 50-day and 200-day MA crossover highlights a potential shift in trend. RSI hovers around 51, indicating a neutral momentum with room for movement.
Also, the MACD crossover hints at a possible bullish phase if buying pressure increases.
XLM market overview
XLM has seen a mixed performance over the past week, fluctuating between $0.320 and $0.360. Recent price action shows an attempt to recover after a short-term downtrend.
With a volume of 26.85M, there is moderate trading activity, but momentum remains uncertain.
The broader market conditions and Bitcoin’s trajectory could influence XLM’s next moves.
Technical analysis suggests…
The 50-day MA (yellow) and 200-day MA (blue) recently formed a bearish crossover, signaling a cautious approach for traders.
However, if the price reclaims the 50-day MA level of $0.354, XLM could break its short-term downtrend.
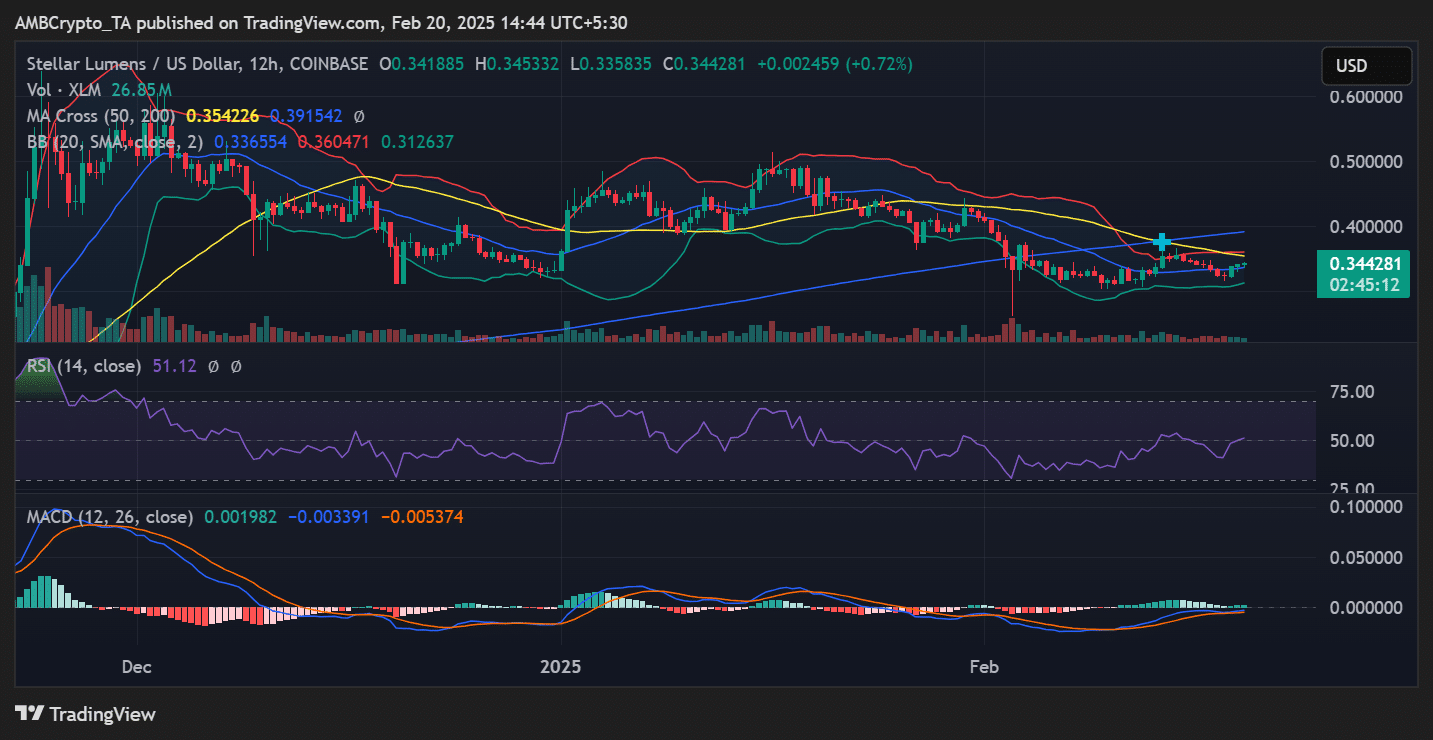
At press time, the RSI was at 51.12, indicating neutral momentum—neither overbought nor oversold. If RSI moves above 60, it could confirm a stronger bullish trend.
The MACD was showing a potential bullish crossover, with the MACD line crossing above the signal line. If the histogram continues to print green bars, XLM could push higher in the coming days.
Bollinger Bands indicated increasing volatility, with the price nearing the middle band, the SMA 20 at $0.336. If XLM breaches the upper band at $0.360, it could trigger an upside breakout.
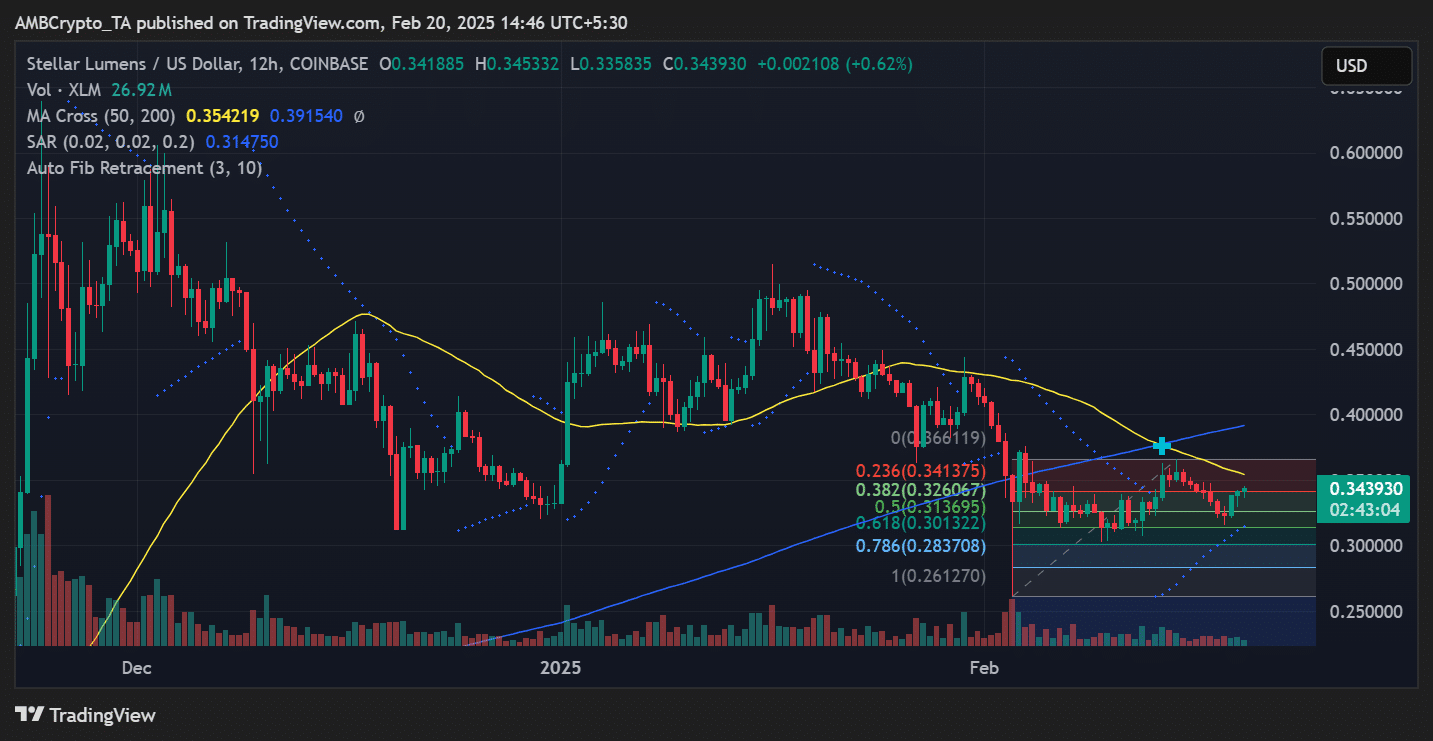
Analyzing Fibonacci retracement levels, key levels to watch include the 23.6% retracement at $0.341 (current price region), 38.2% retracement at $0.326 (support zone), and 61.8% retracement at $0.301 (major support).
A push above $0.360 (Fibonacci 0%) could pave the way for $0.380-$0.400.
XLM price prediction: What’s next?
If XLM breaks above $0.360, it could target $0.380-$0.400, supported by RSI strength and MACD bullish momentum.
However, if XLM fails to hold $0.320, it may test $0.300-$0.283, aligning with Fibonacci retracement levels.
XLM’s short-term outlook hinges on breaking $0.360 and maintaining above the 50-day MA.
Traders should watch the RSI movement, MACD confirmation, and market trends for further clarity. If bullish momentum builds, XLM could see a solid breakout in the coming days.