STEPN: GMT forms a short-term range, offers opportunities at these levels

Disclaimer: The findings of the following analysis are the sole opinions of the writer and should not be considered investment advice
STEPN, the move-to-earn fitness app, saw its token GMT register strong gains in March and April. However, it has been falling in the past two weeks. The short-term price action indicated that GMT was trading within a range. The extremes of the range could offer opportunities to buy and sell the asset.
GMT- 1 Hour Chart
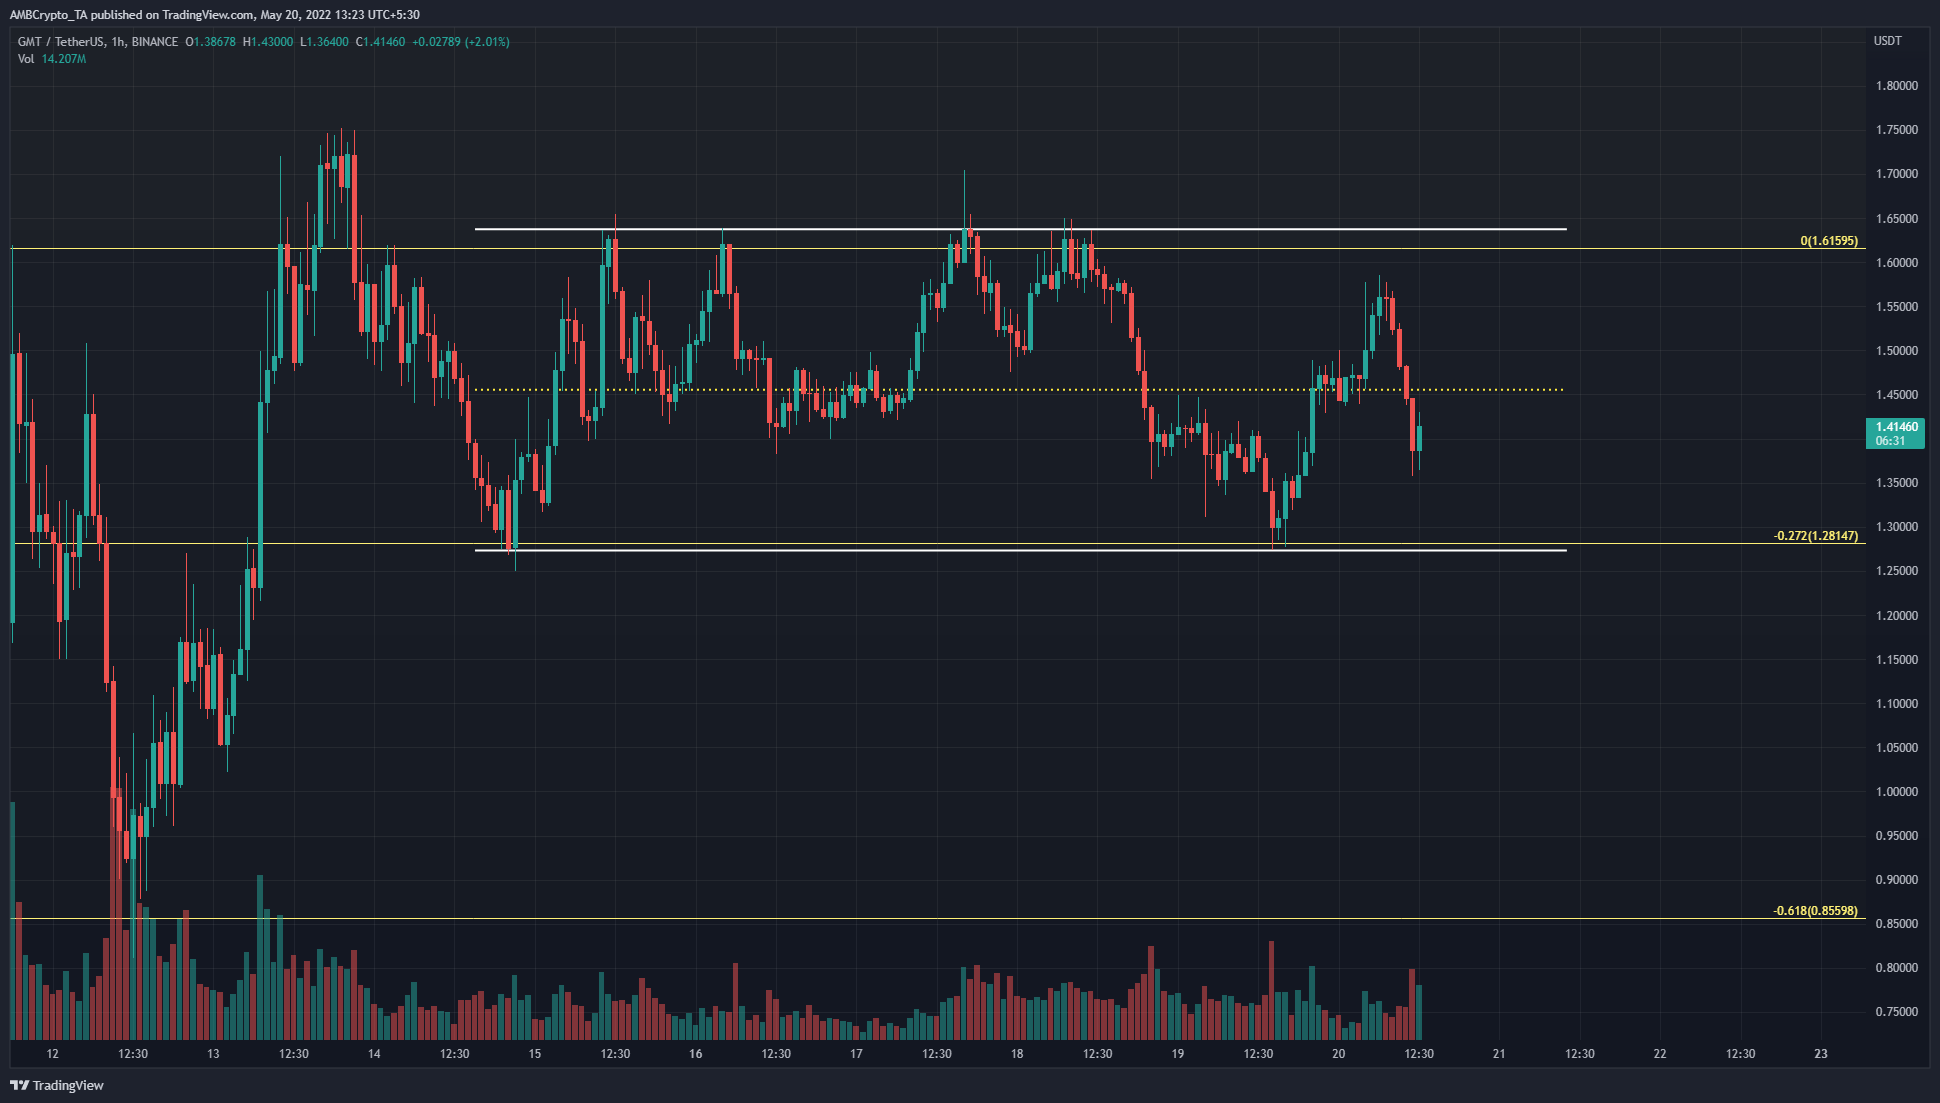
In the past week, the price has ranged from the $1.63 highs to the $1.275 lows (white). Moreover, the Fibonacci extension levels (yellow) showed that $1.28 is actually the 27.2% extension level of GMT’s drop from $2.84 to $1.61 earlier this month.
In the time period that GMT has traded within this range, the trading volume has been relatively steady and not particularly high except for certain sessions. Hence, this pointed to the likelihood that GMT was in a phase of accumulation or distribution, and a breakout could be around the corner.
Would this breakout be bullish or bearish? It was uncertain at press time. A lot would depend on Bitcoin’s price action, and it was still unclear whether the market has found a bottom, or whether this is calm before another bearish storm.
Rationale
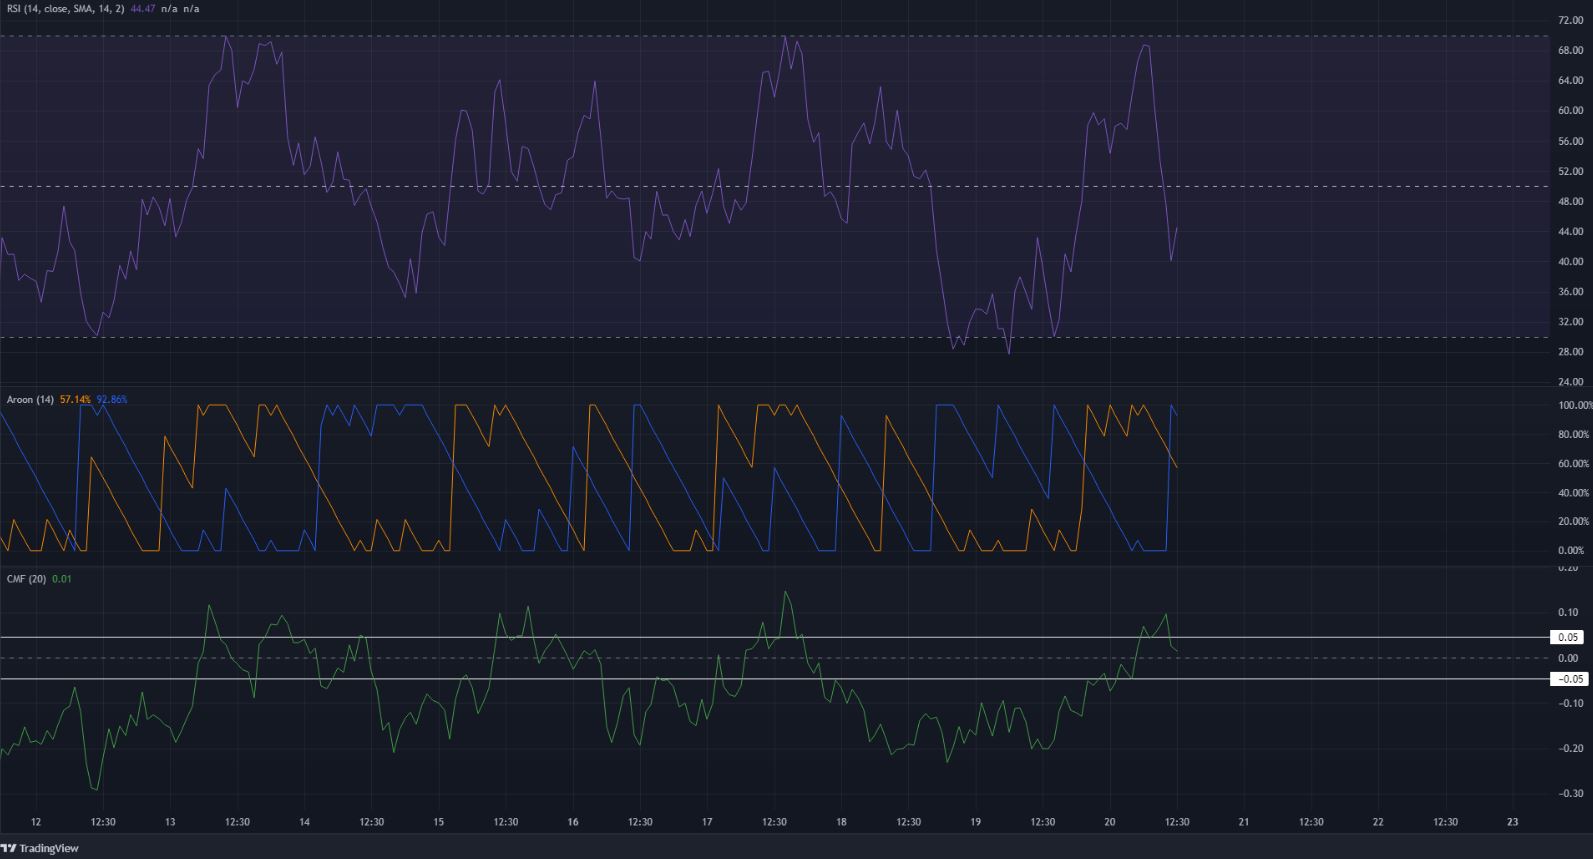
The RSI on the hourly chart has not stayed above or below the neutral 50 line for more than a couple of days and has oscillated from strongly bullish to strongly bearish momentum multiple times in the past week. This is a sign of high volatility, but also shows that a strong, steady trend wasn’t present.
The Aroon indicator also showed both the bulls and the bears to take turns being dominant on the charts, as the Aroon Up and Aroon Down (orange and blue respectively) have crisscrossed each other multiple times within a relatively short period of time.
The Chaikin Money Flow has predominantly stayed below the -0.05 mark, which indicated that capital flow was primarily directed out of the market, and signaled seller strength.
Conclusion
Caution is advisable for breakout traders, while systems that work well trading a rangebound asset could look to take advantage of the $1.28 and $1.61 levels to buy and sell respectively. Bitcoin is likely to have a large impact on the direction of a breakout for GMT.


