Terra, Monero, SAND Price Analysis: 09 May
The broader market took a nearly 4% 24-hour plunge on its global market cap at press time. Consequently, Terra, Monero, and SAND’s 4-hour RSI dived to exhibit a bearish inclination. The bulls needed to now hold on to their immediate grounds while stalling the consistent sell-off on high volumes.
Terra (LUNA)
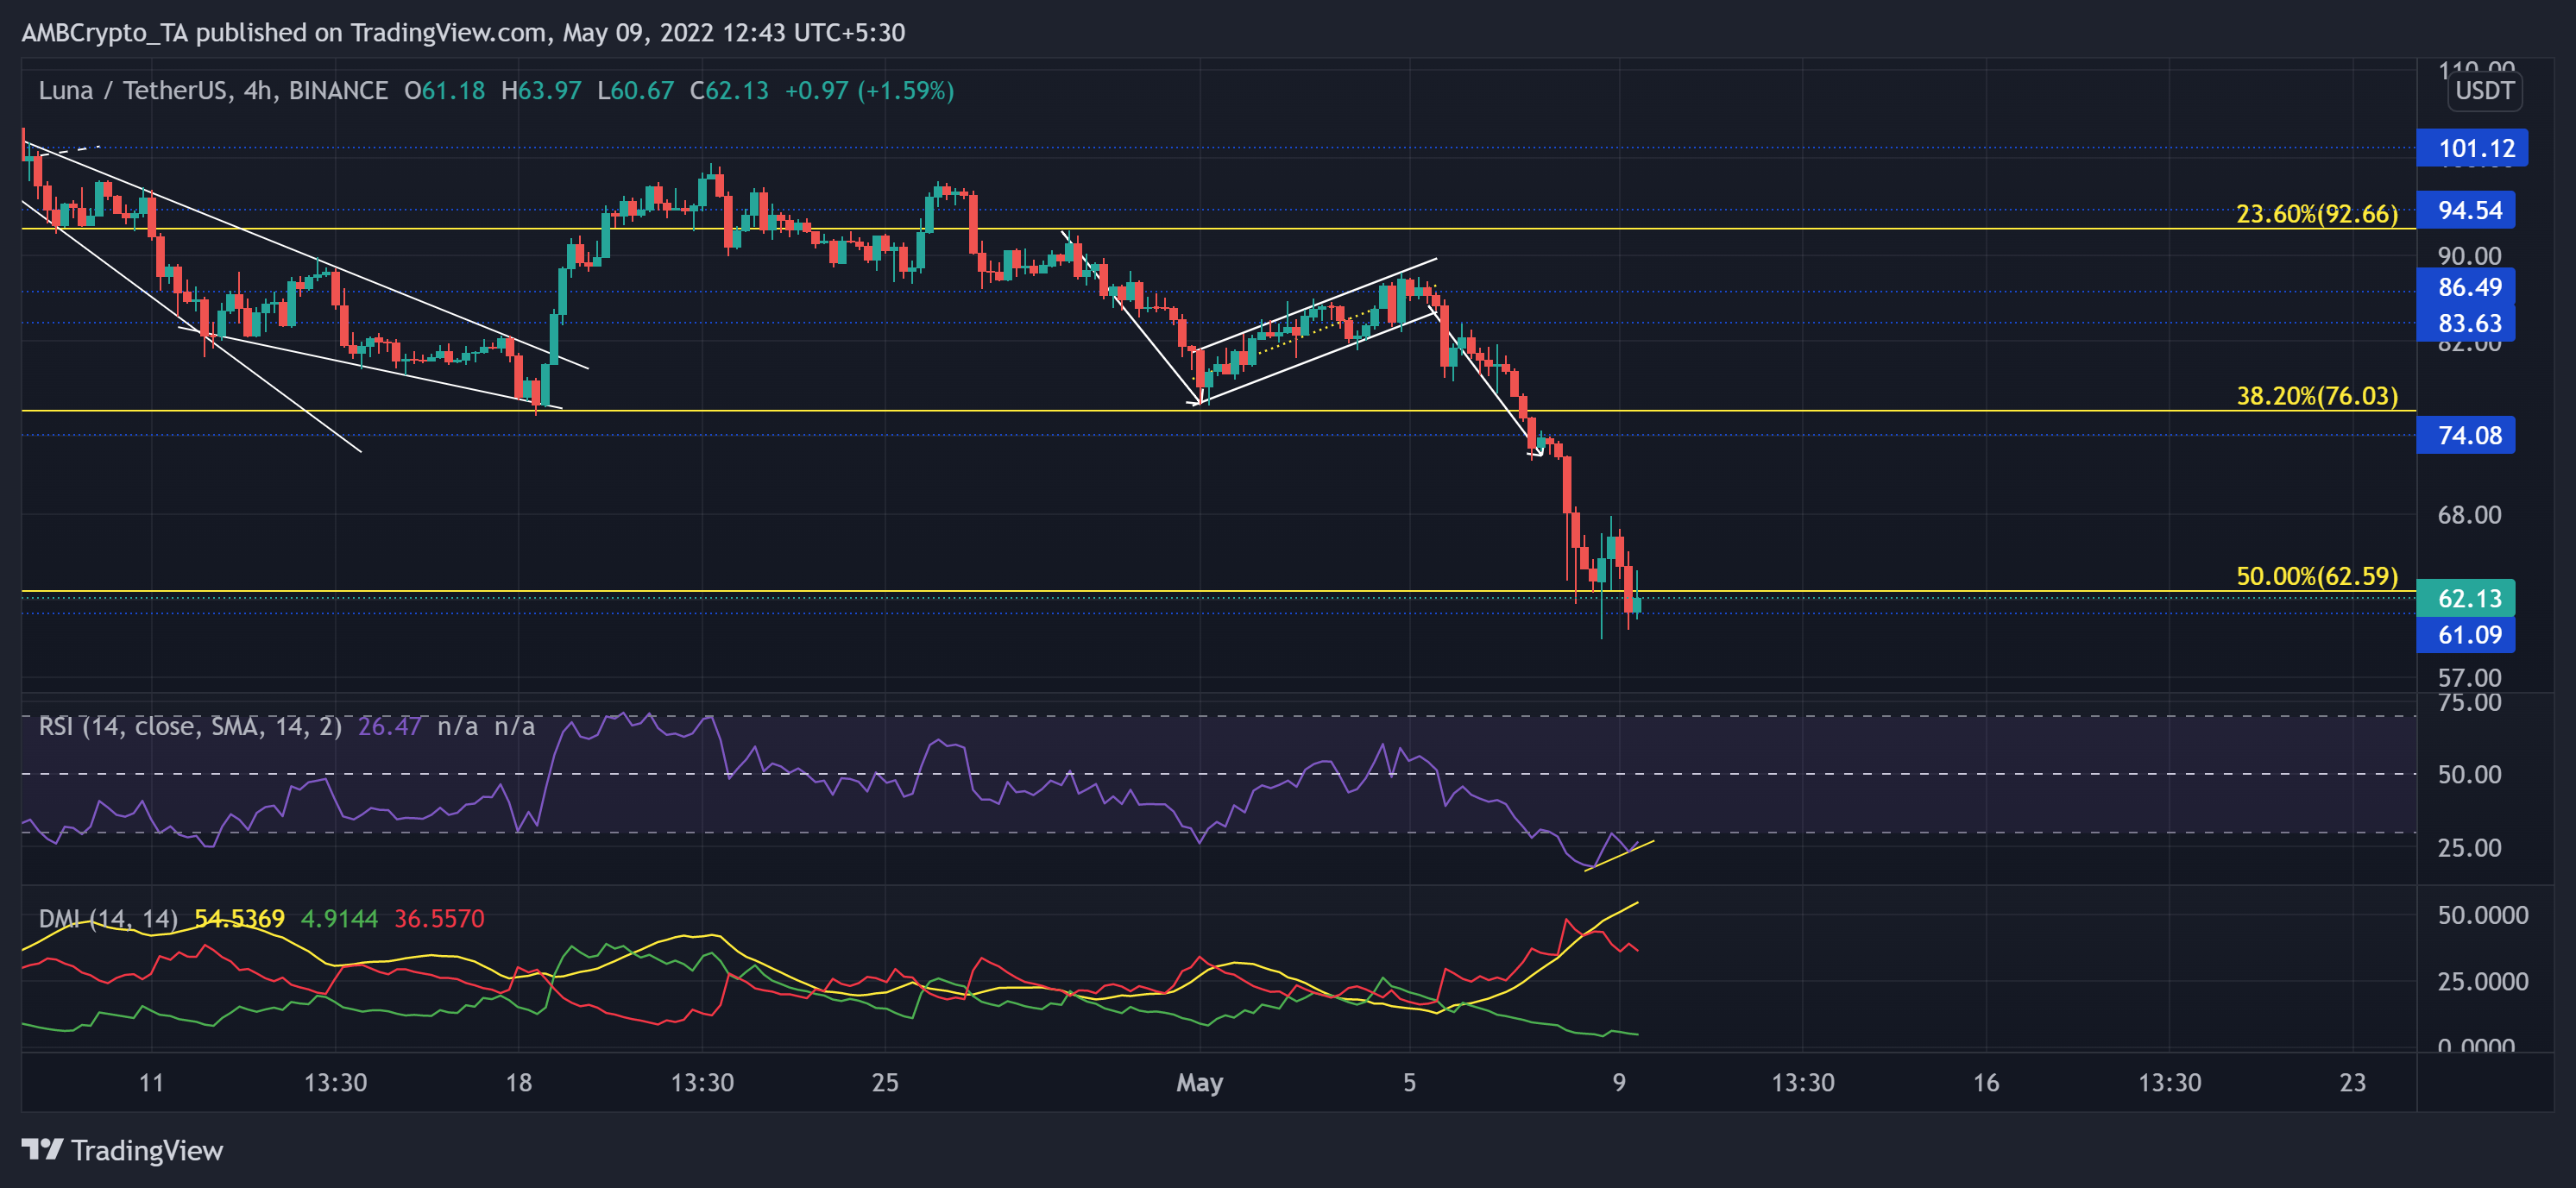
As the $101-resistance posed a hefty hurdle in the December rally, LUNA’s recession phase initiated. After the price kept bouncing around the long-term 61.8% Fibonacci support for a few weeks, the buyers finally found their lost thrust.
Consequently, LUNA saw an over 144% growth (from 22 Feb) and rallied all the way up to its ATH on 5 April. Over the last month, the sellers quickly propelled a correction while LUNA lost 23.6%, 38.2%, and 50% Fibonacci support.
At press time, LUNA traded at $62.13, down by 4.72% in the last 24 hours. The RSI sailed in the oversold region after the sellers took charge of the recent trend. Further, due to a bullish divergence with price, a near-term revival seemed plausible. With the -DI finally looking south, this could ease the selling pressure in the coming sessions.
Monero (XMR)
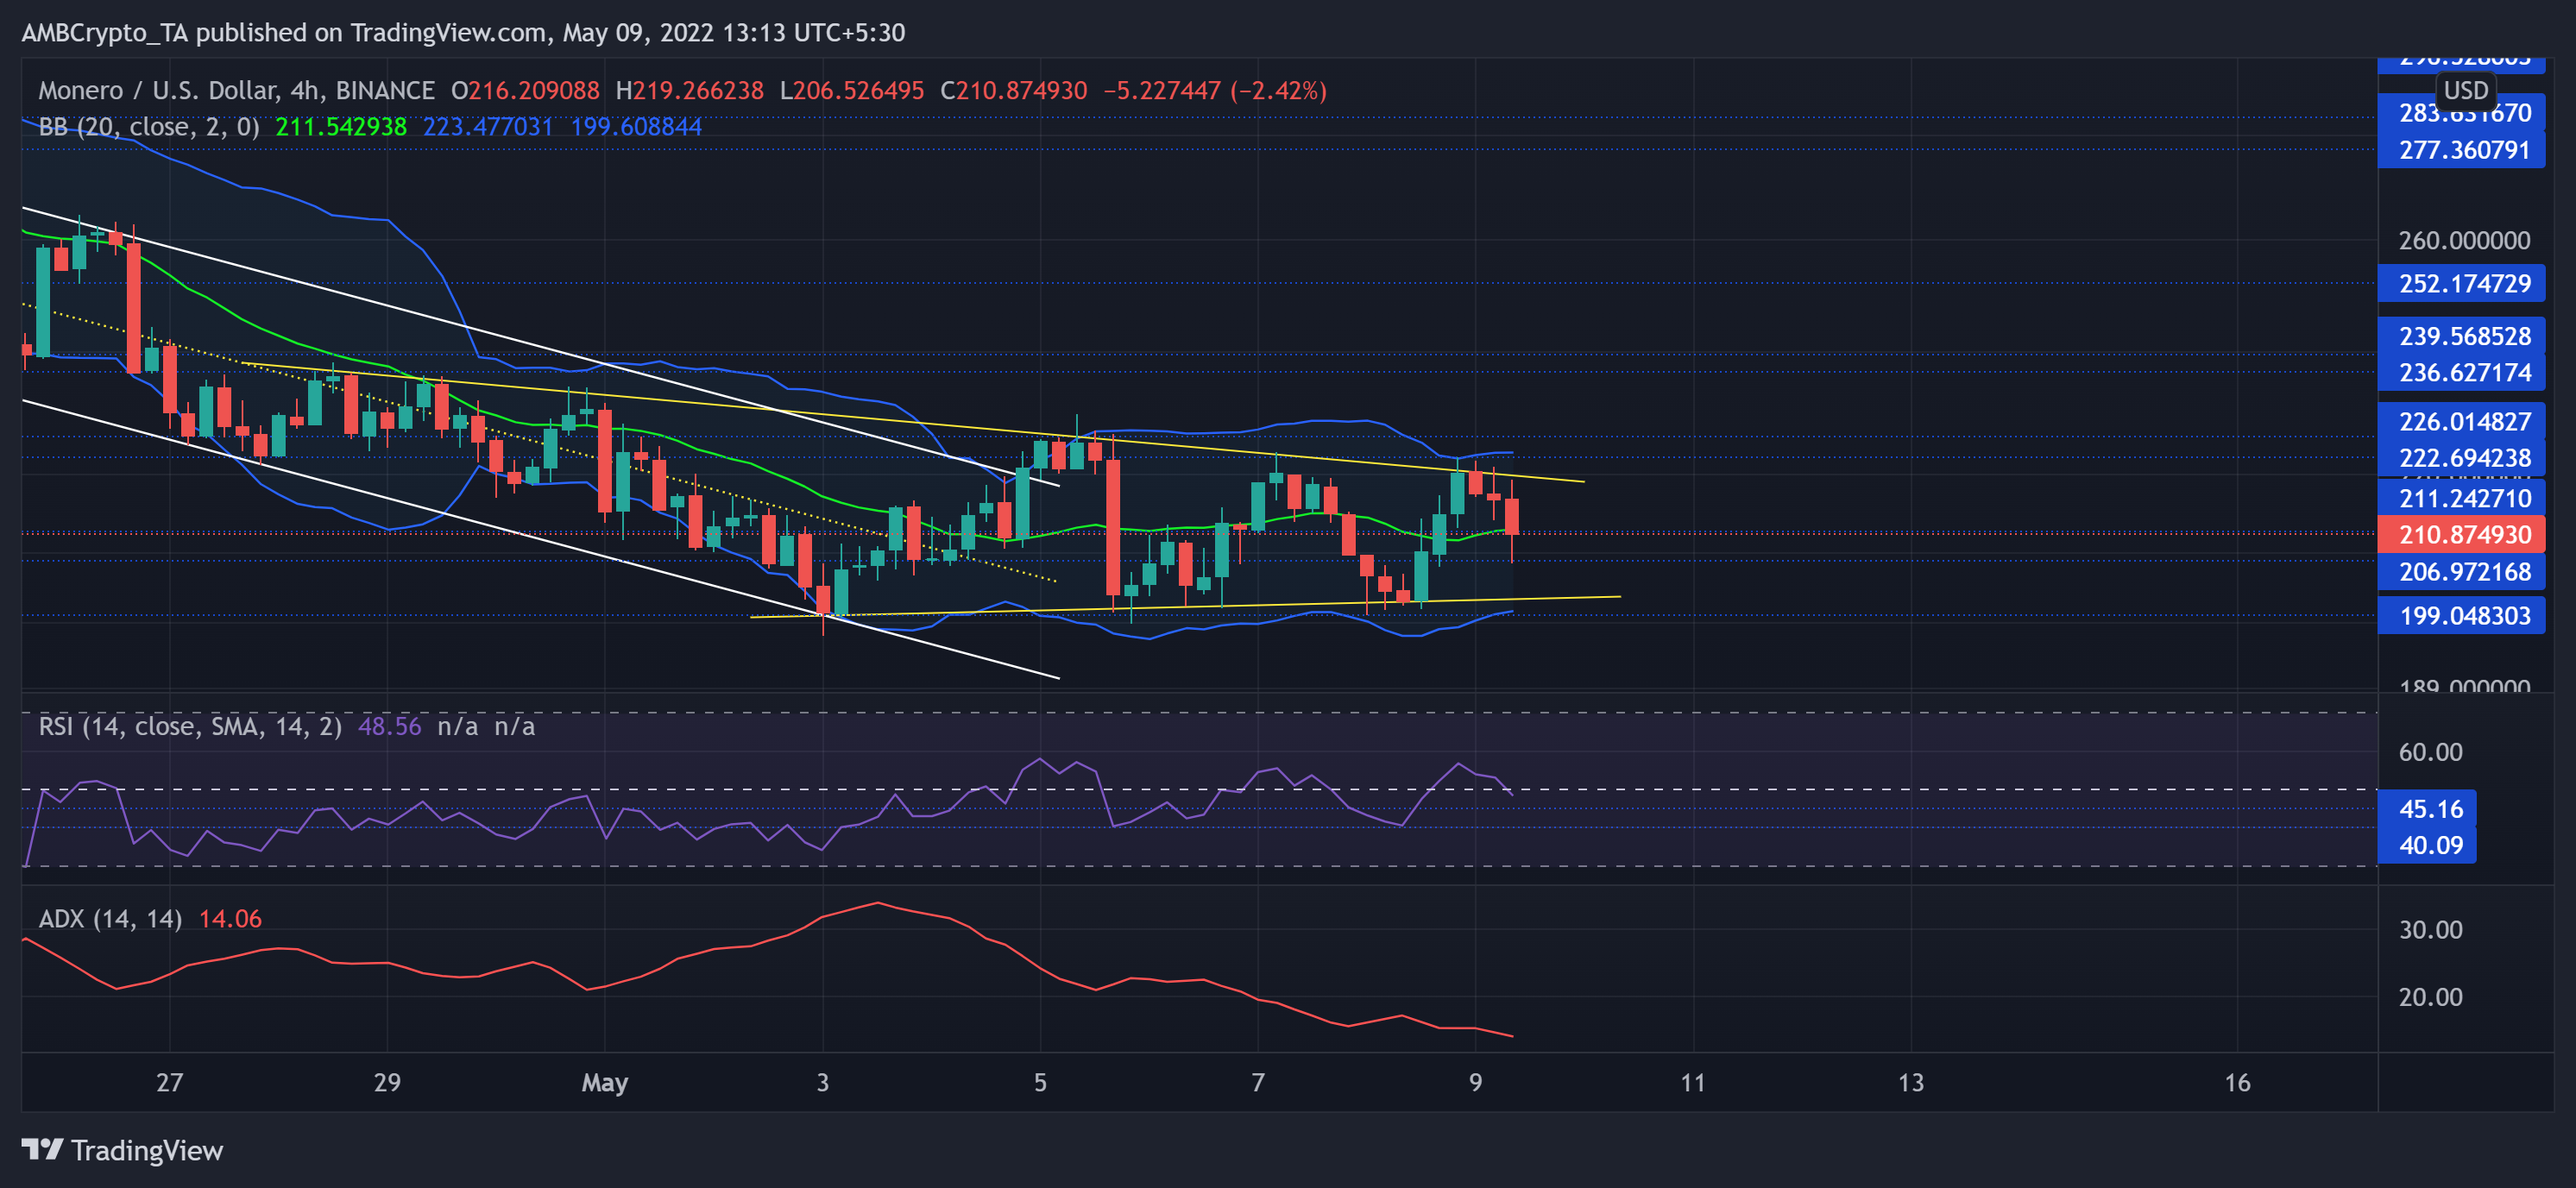
XMR’s recent bull run took an expected u-turn from the eight-month ceiling in the $283-zone. The price then rushed to match its multi-month lows at the $199-baseline.
The previous bull run sprang after XMR plunged to its yearly lows on 24 February. With the $283-mark keeping a check on the bull power, the sellers kept the alt under the basis line (green) of the Bollinger Bands for the most part.
At press time, the alt traded at $210.874. The RSI took a plunge below the equilibrium after the recent sell-off. From here on, the 40-45 range would be crucial for clinching a recovery in the days to come. But the alt’s ADX (red) displayed a rather substantially weak directional trend.
The Sandbox (SAND)
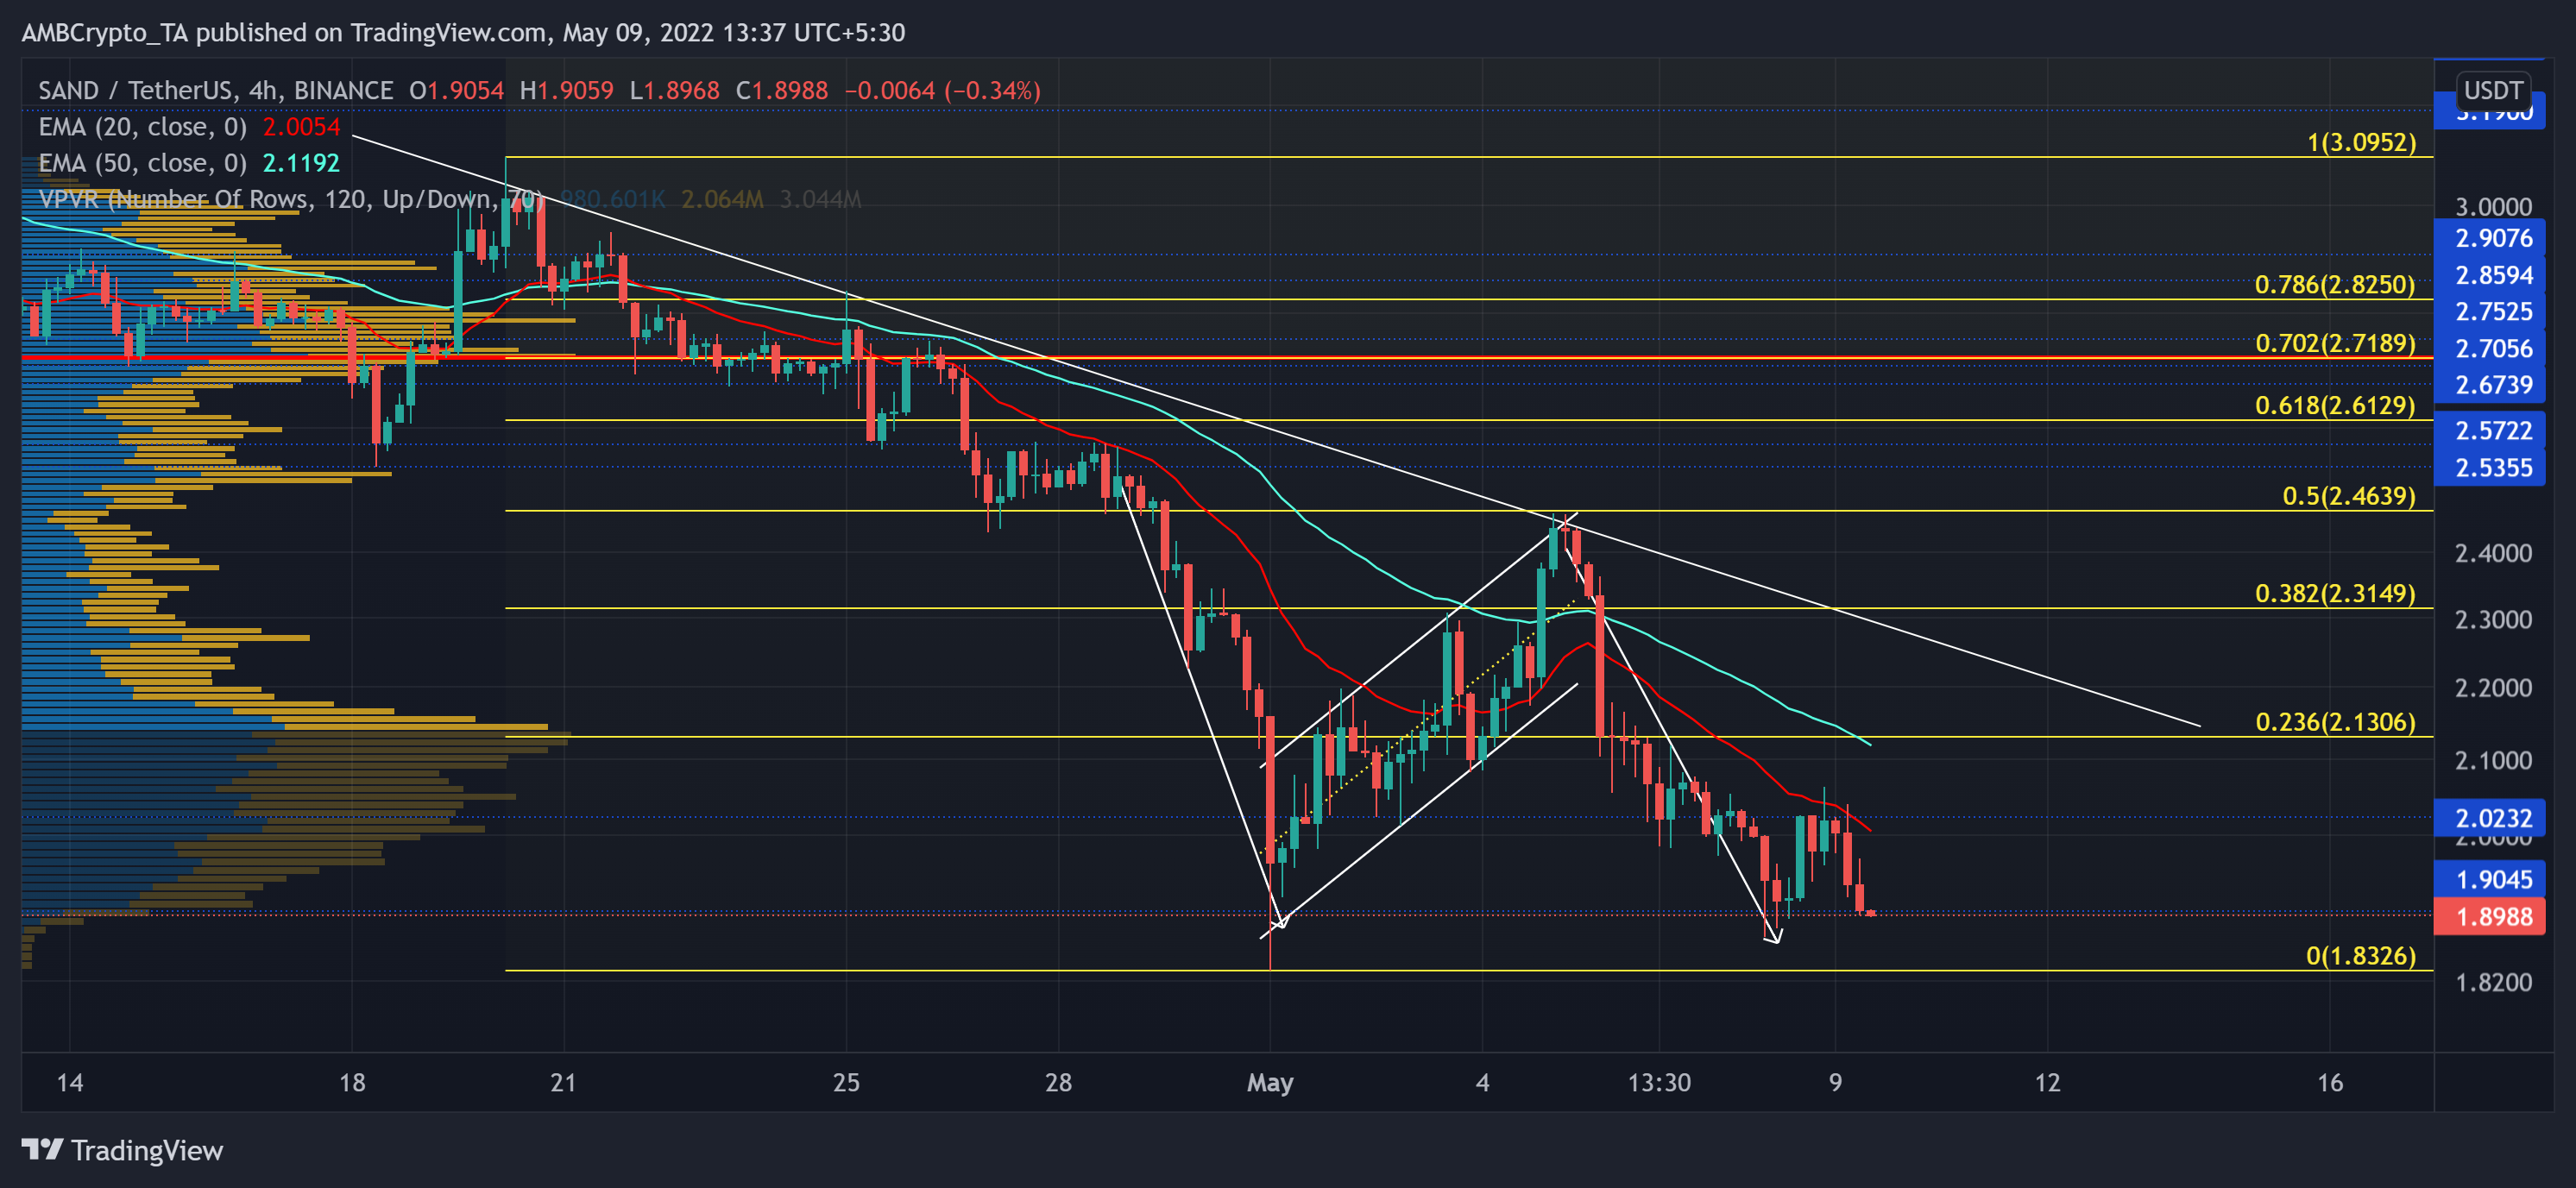
After the 38.2% Fibonacci resistance refuted the buying rally, the sellers re-navigated the trend in their favor by sinking the price toward the $1.9 base. This trajectory has affected the buyer’s ability to topple the trendline resistance (white).
As the altcoin witnessed a bearish flag on the 4-hour timeframe, the expected downward slide kept SAND below its 20 EMA (red) and 50 EMA (cyan). Consequently, SAND was down by nearly 22.9% over the last four days. Now it entered into compression in the $1.9-$2 zone. At press time, SAND traded at $0.0. Now, the 20 EMA would look to curb possible revival rallies in the near term.

