Terra, Solana, Shiba Inu Price Analysis: 15 April

Bitcoin was trading at $40.1k, just above an area of support at $39.5k. If Bitcoin sees a drop in the next few days, most of the rest of the altcoin market can be expected to follow. Terra and Solana appeared to be trading within a short-term range, although Solana had a more bullish outlook.
Terra (LUNA)
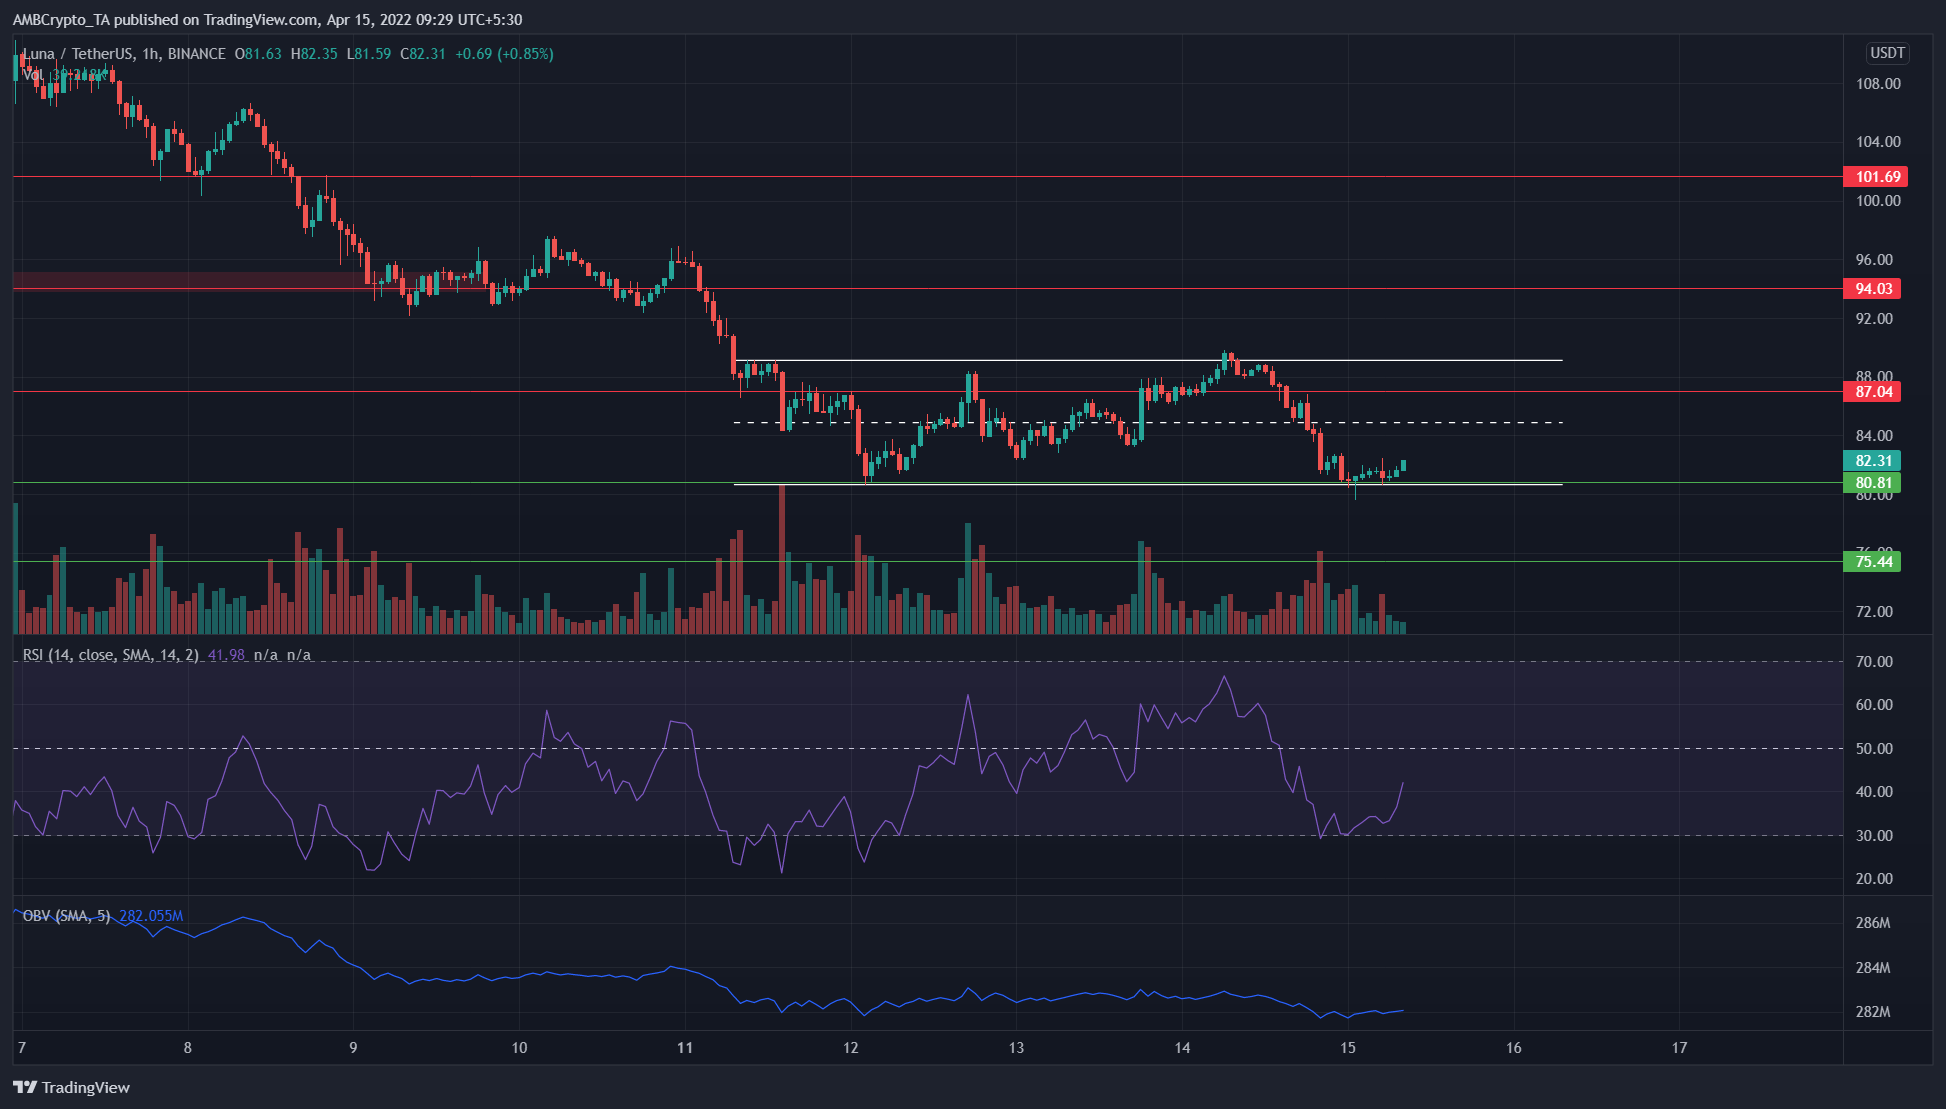
In white is highlighted a short-term range that LUNA has been trading within for the past four days. The range lows and highs lie at $80.7 and $89.1. At the time of writing, the price of LUNA was $82.31 and rising.
The RSI was in bearish territory with a value of 41, but if it can break above neutral 50 in the next few hours, it would be a good sign for the bulls.
However, this was only a range, and $88-$90 should be used to book profits. The OBV has been in a downtrend for nearly ten days, and was likely to see more of the same.
Solana (SOL)
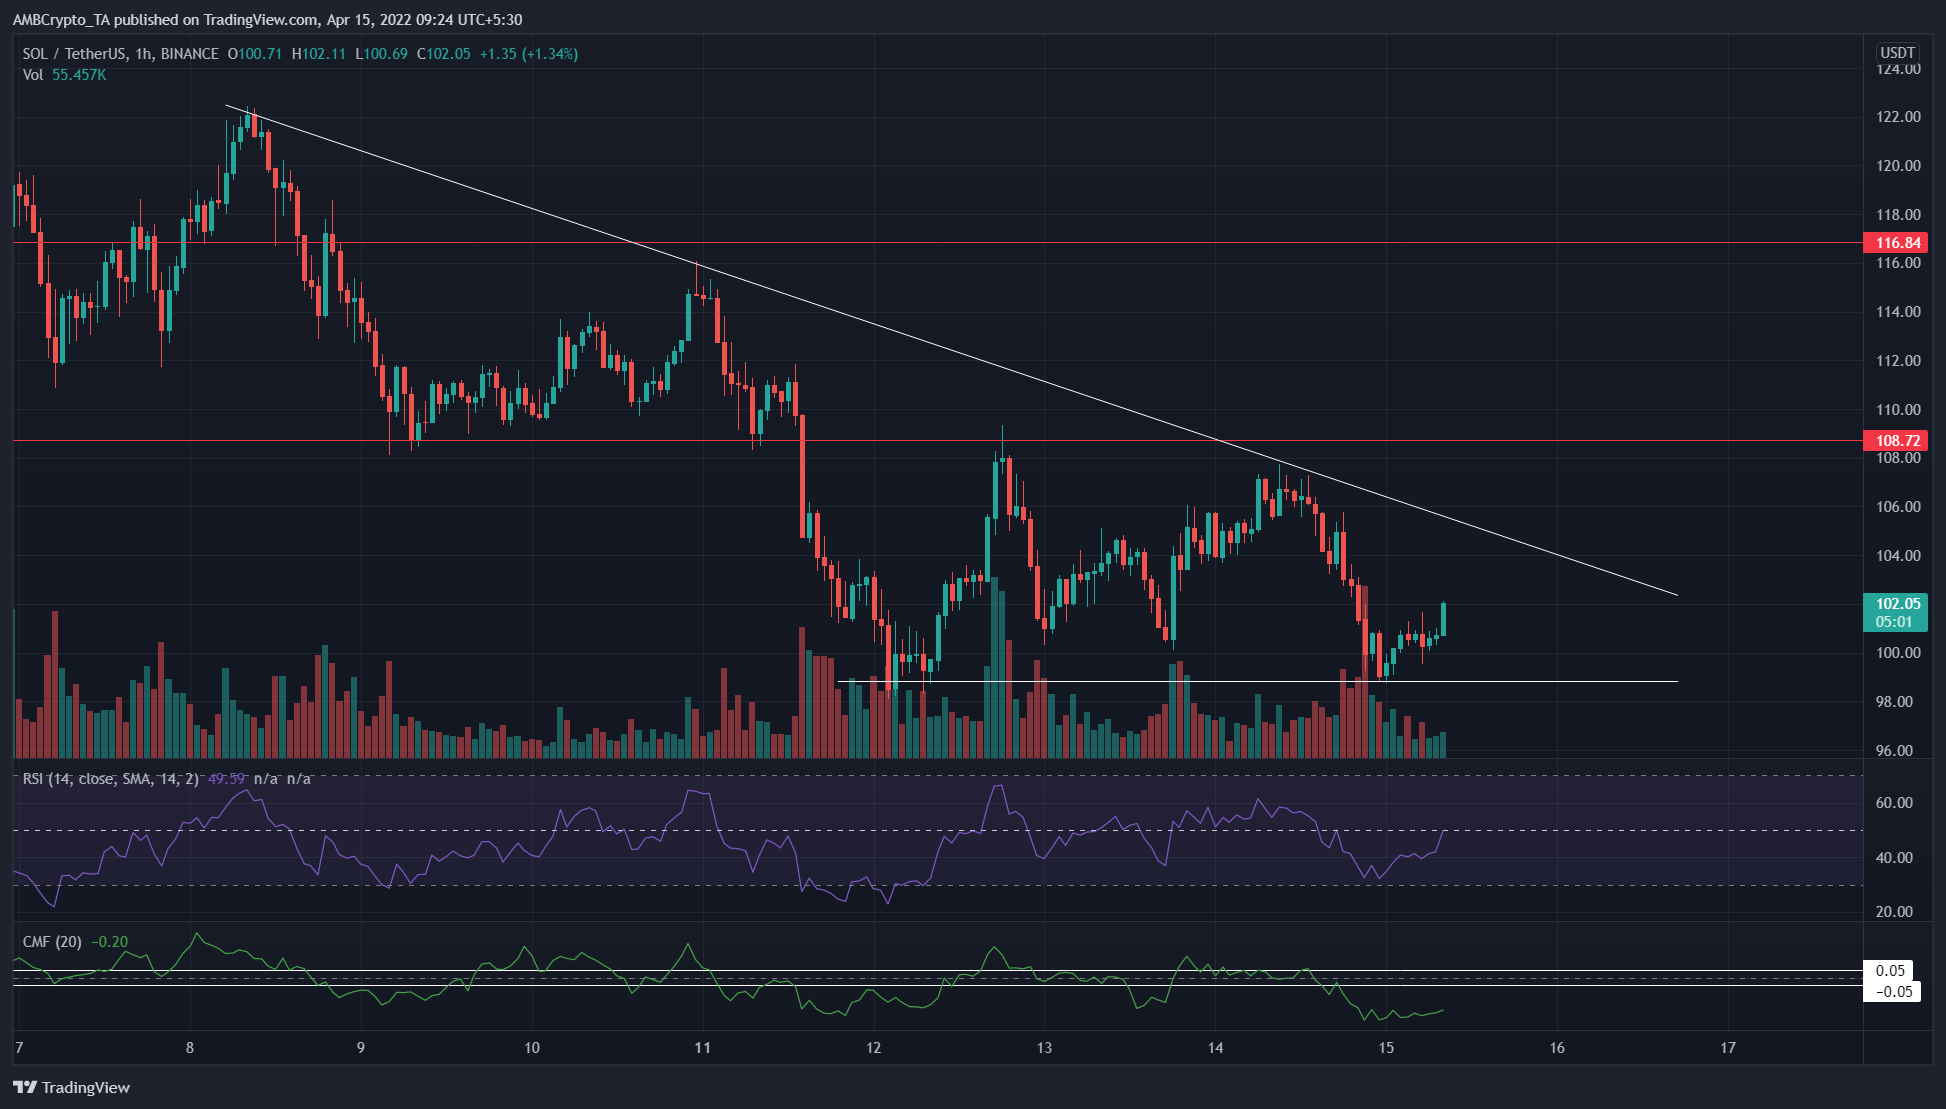
SOL has also been trading within a range from $98-$108 for the past three days. Zooming out slightly further, a possible (but not perfect) descending triangle pattern (white) was spotted.
Therefore, if the price can break above the descending trendline resistance as well as the $108 resistance, it could be a sign of a bullish near-term trend.
The RSI was on the verge of crossing over above the neutral 50 line. However, the CMF was far beneath the -0.05 mark, which showed selling pressure was dominant in the SOL market.
Shiba Inu (SHIB)
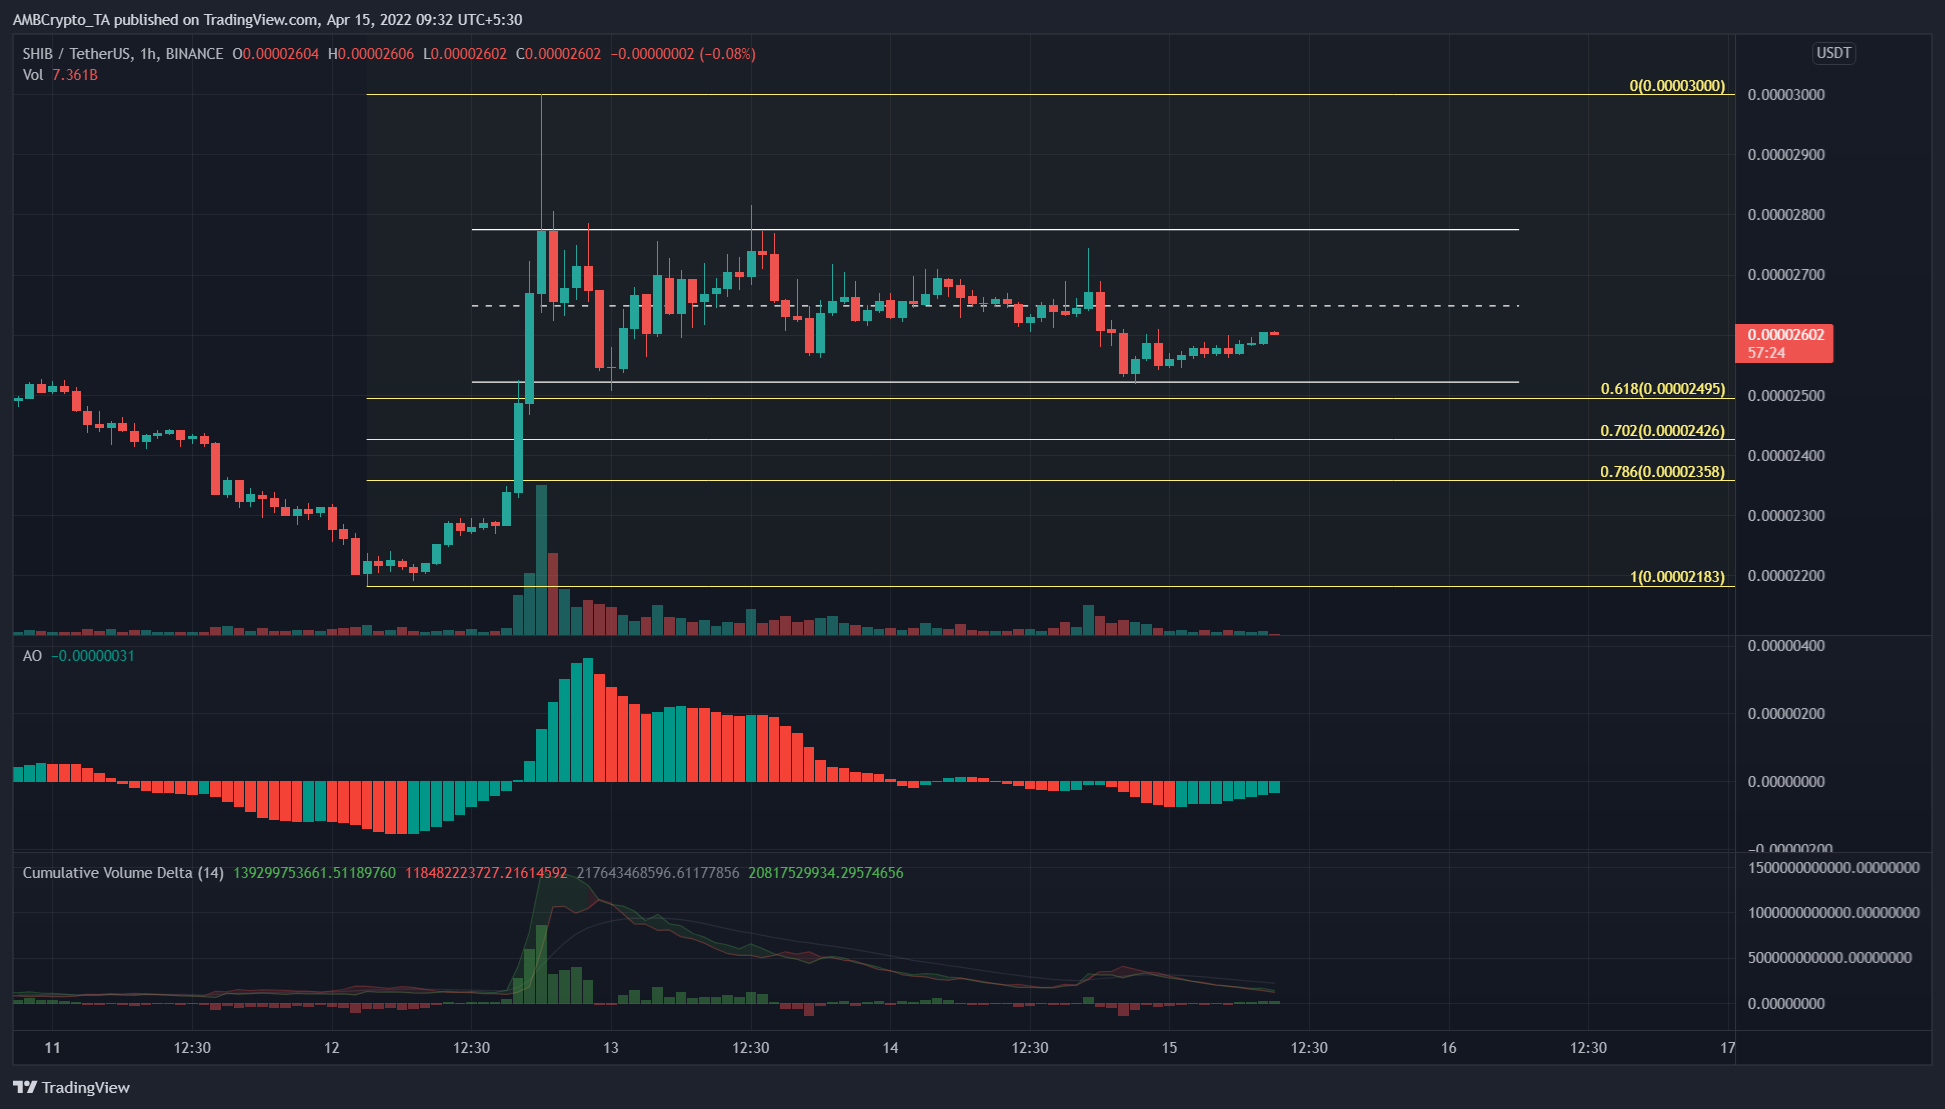
SHIB has also been trading within a range from $0.000025-$0.00002775, a near 10% difference from the lows. The CVD was quite flat as it flip-flopped from buyer to seller pressure but did not show significant pressure from either side in the past couple of days.
On a similar note, the Awesome Oscillator was also relatively flat, although it was beneath the zero line to show bearish momentum.
The Fibonacci retracement levels (yellow) showed that beneath the range lows are another bunch of support levels that SHIB could see a bullish reaction at. However, Bitcoin would have a large influence as well.