Tezos Price Analysis: 29 January

Disclaimer: The findings of the following analysis are the sole opinions of the writer and should not be taken as investment advice
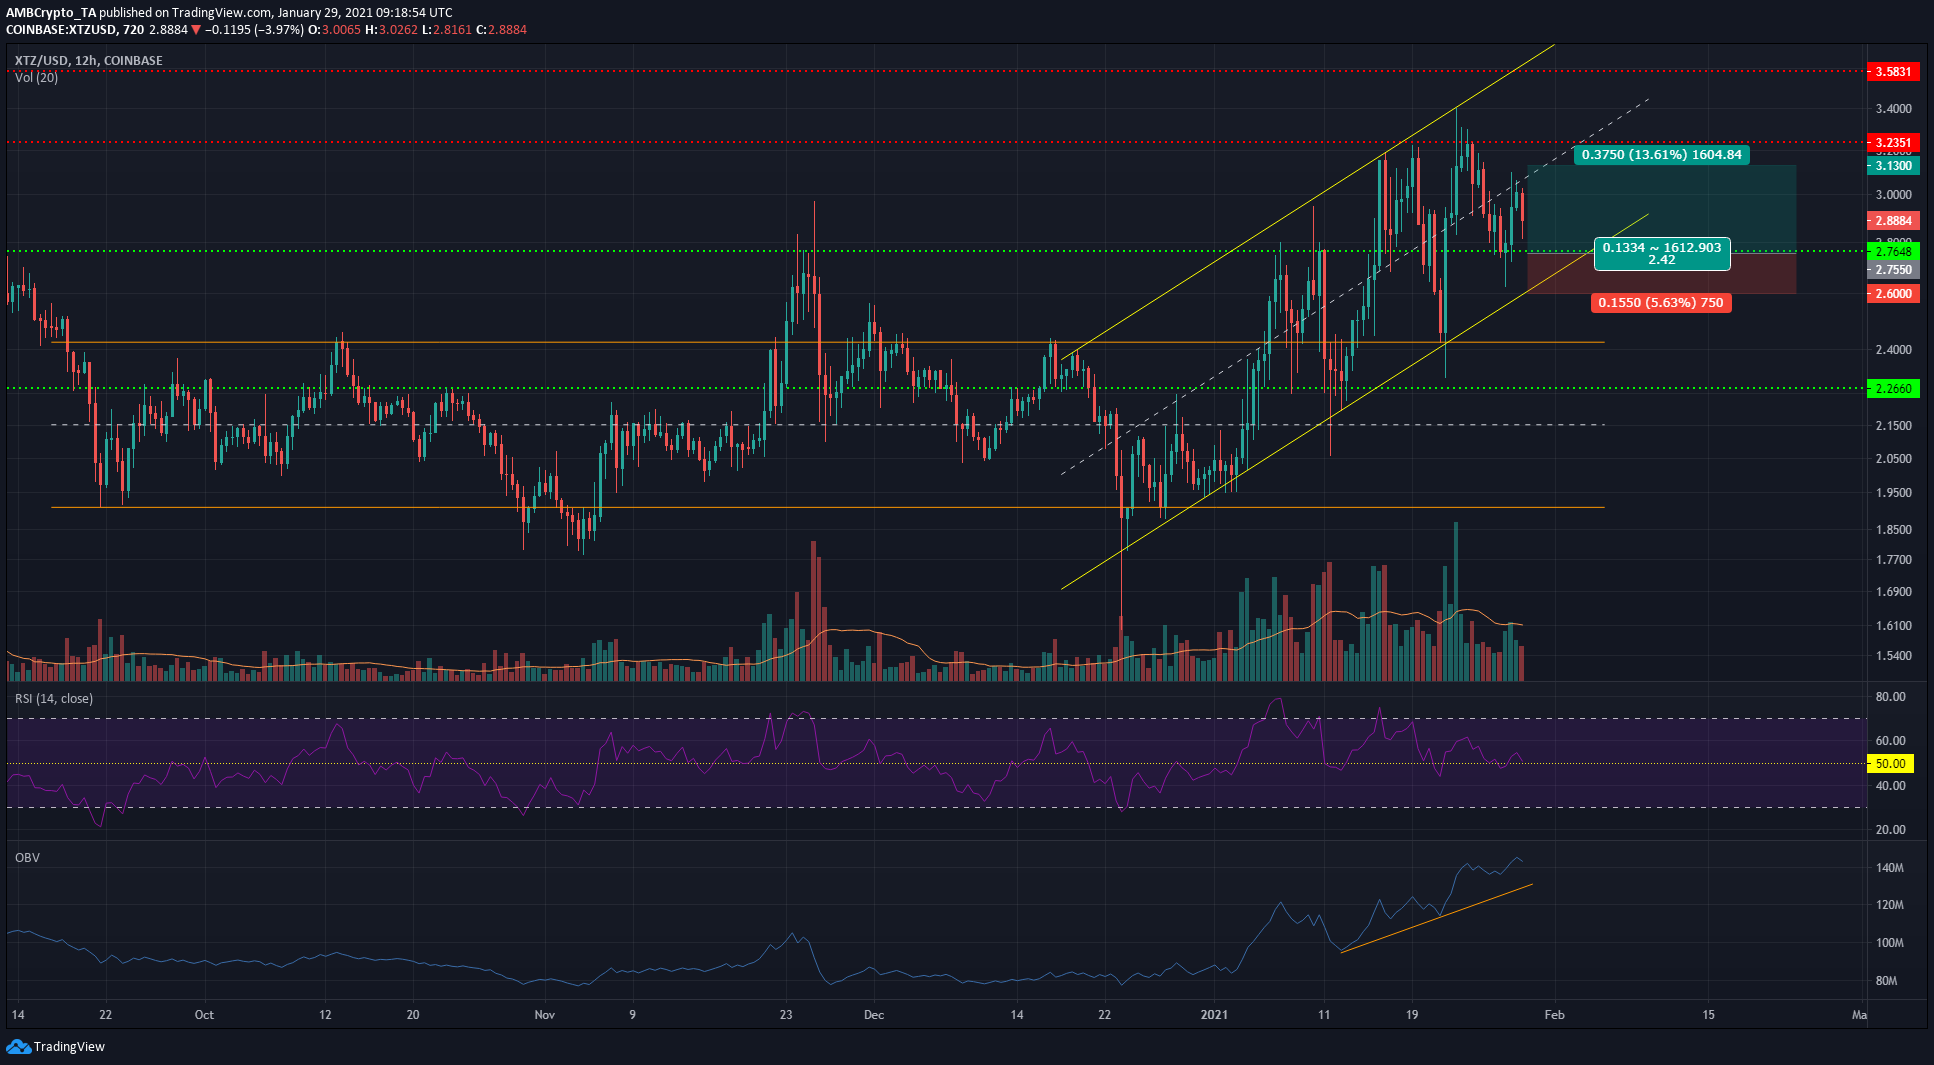
Tezos has been largely dormant in the markets since the month of September. While Etheruem’s surge past $1,000 in early January sparked some life into Tezos, it was still not enough for XTZ to break past the $2.8-barrier. It should be noted, however, that the past few days did see XTZ break out of the range and establish an uptrend on the charts.
Tezos 12-hour chart

Source: XTZ/USD on TradingView
Tezos has traded within the range (orange) of $1.9 to $2.42 since mid-September, and an attempted breakout in November was met by stiff resistance, with the crypto forced back within the range.
However, the past two weeks have seen some decisive moves in the XTZ market. It broke out of the range to test the resistance at $2.76, pulled back to retest $2.26 as support, and formed an ascending channel (yellow).
Rationale
The past 24 hours saw XTZ rejected from the mid-point of this channel, indicating that a move to the lower boundary of the channel was brewing. In tandem, the RSI also dropped towards the neutral 50-mark to show weakening bullish momentum.
A long position at the $2.76-level of support can see XTZ bounce back towards the mid-point of the channel. This was because the OBV has been on an uptrend since the price broke out of the $1.9-$2.42 range.
Finally, the steady buying volume indicated that a defense of the $2.76-level was likely.
Important levels to watch out for
Entry: $2.755
Stop-loss: $3.13
Take-profit: $2.6
Risk-to-reward: 2.42
Conclusion
Should a retest of the $2.76-level happen, the buyer interest behind the latest price rally will likely see the bulls defend the level of support. Failure to hold on could see the ascending channel’s lower boundary tested.
The indicators and price action pointed to a move to the upside for XTZ, while a break to the downside under the ascending channel will invalidate the long position. A bounce off of $2.76 would likely see XTZ move towards the middle of the rising channel in the coming days, making it a take-profit target level.


