Tezos, Waves, IOTA Price Analysis: 03 July

The global crypto-market cap’s 4.40% hike was shared by lower-ranked alts on their charts, with their prices moving in correlation with Bitcoin and registering significant double-digit gains over the past week. Tezos, WAVES, and IOTA were trading in the green within their constricted price ranges, at press time, and had started to consolidate the gains made over the past few days.
Bullish momentum was on the rise for Tezos and IOTA, however, 20% gains for WAVES triggered a sell-off and sent the coin into a bearish dizzy. Further, the absence of market volatility for these altcoins meant price action would remain restricted going forward.
Tezos [XTZ]
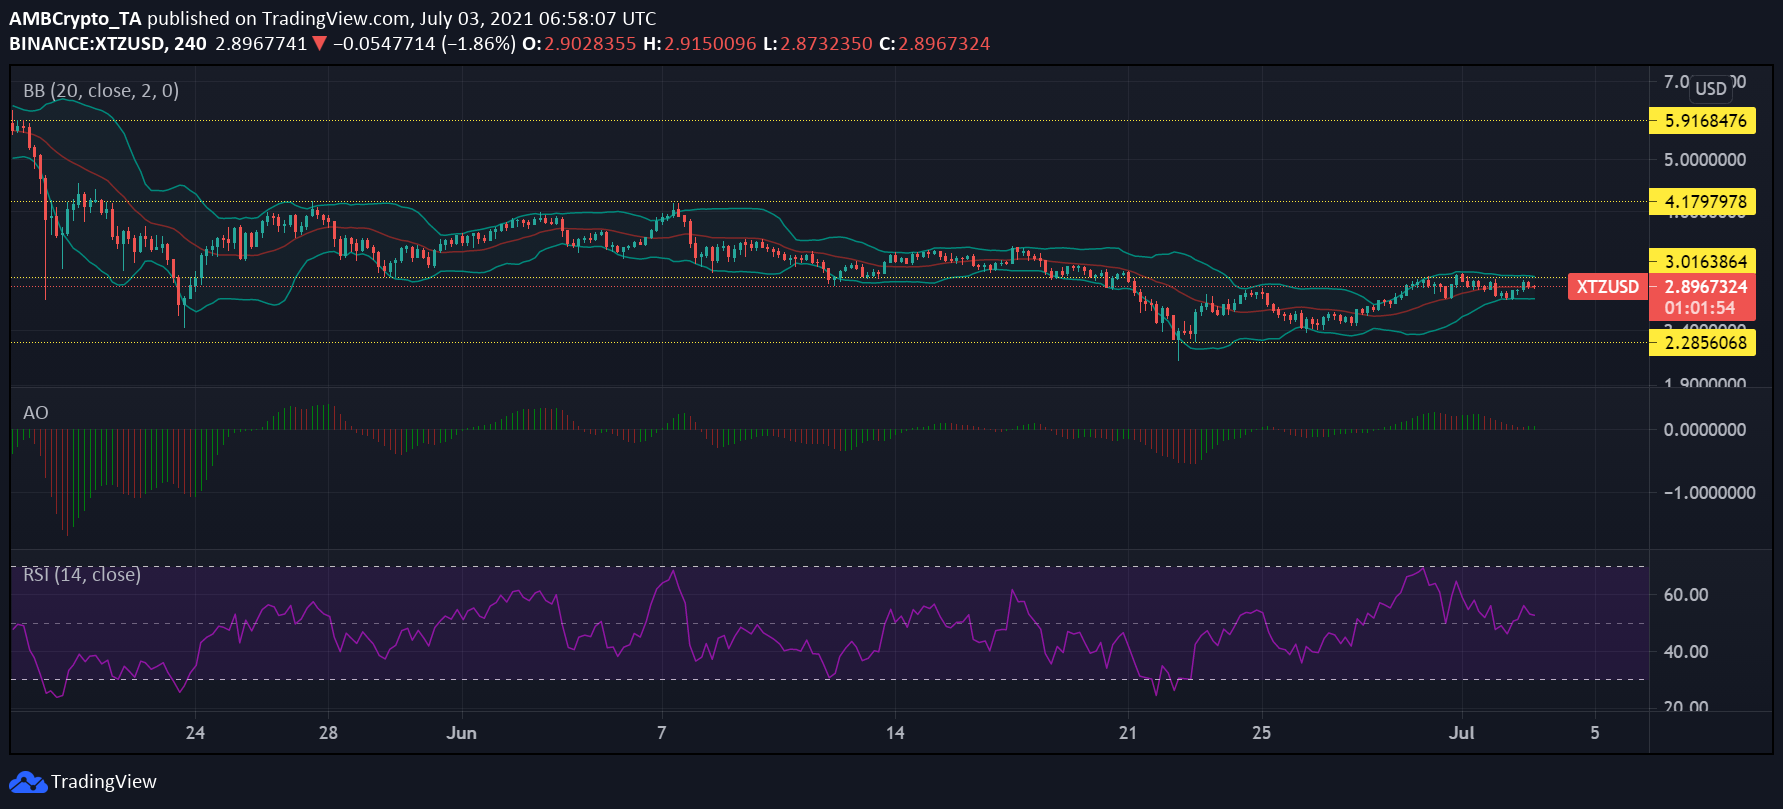
Tezos’s price chart noted some gains over the past few days. Its 1-day price hike was 3.3% while over the week, it was over 13%. Since the 21 June crash, the coin had been oscillating between the resistance at $3.01 and support at $2.28. Valued at $2.89 at press time, it was testing the resistance level it has held on for weeks.
The Bollinger Bands for the asset ran parallel to one another, indicating a slowdown in market volatility and stable price movement going forward. The appearance of red bars on the Awesome Oscillator’s histogram pointed to the build-up of bullish momentum.
As the crypto’s buy-outs increased, the Relative Strength Index (RSI) moved over the median line and into bullish territory. However, the bears responded by pushing the indicator south again with a reading of 53, at the time of writing.
Even in the presence of positive bullish momentum, the alt seemed unlikely to break through the strong resistance at $3.01. It will continue to move between its constricted price range.
WAVES

WAVES too noted significant price gains. It had been moving north since 23 June, however, this came to a halt after it again began a sideways journey from 30 June after unsuccessfully trying to break the $16.8 ceiling. The coin’s trading volume fell by 18.19%, even as it recovered by 3.5% in 24 hours.
The Parabolic SAR’s dotted line hovered above the candlesticks after the breakout attempt as the coin continued its bearish trend. The Chaikin Money Flow too fell through the zone of equilibrium into bearish territory as sell-offs triggered capital outflows.
A bearish crossover took place between the MACD and Signal lines on 1 June, and WAVES has progressed with bearish momentum ever since. The lines’ convergence did suggest a reverse crossover going forward, however.
IOTA
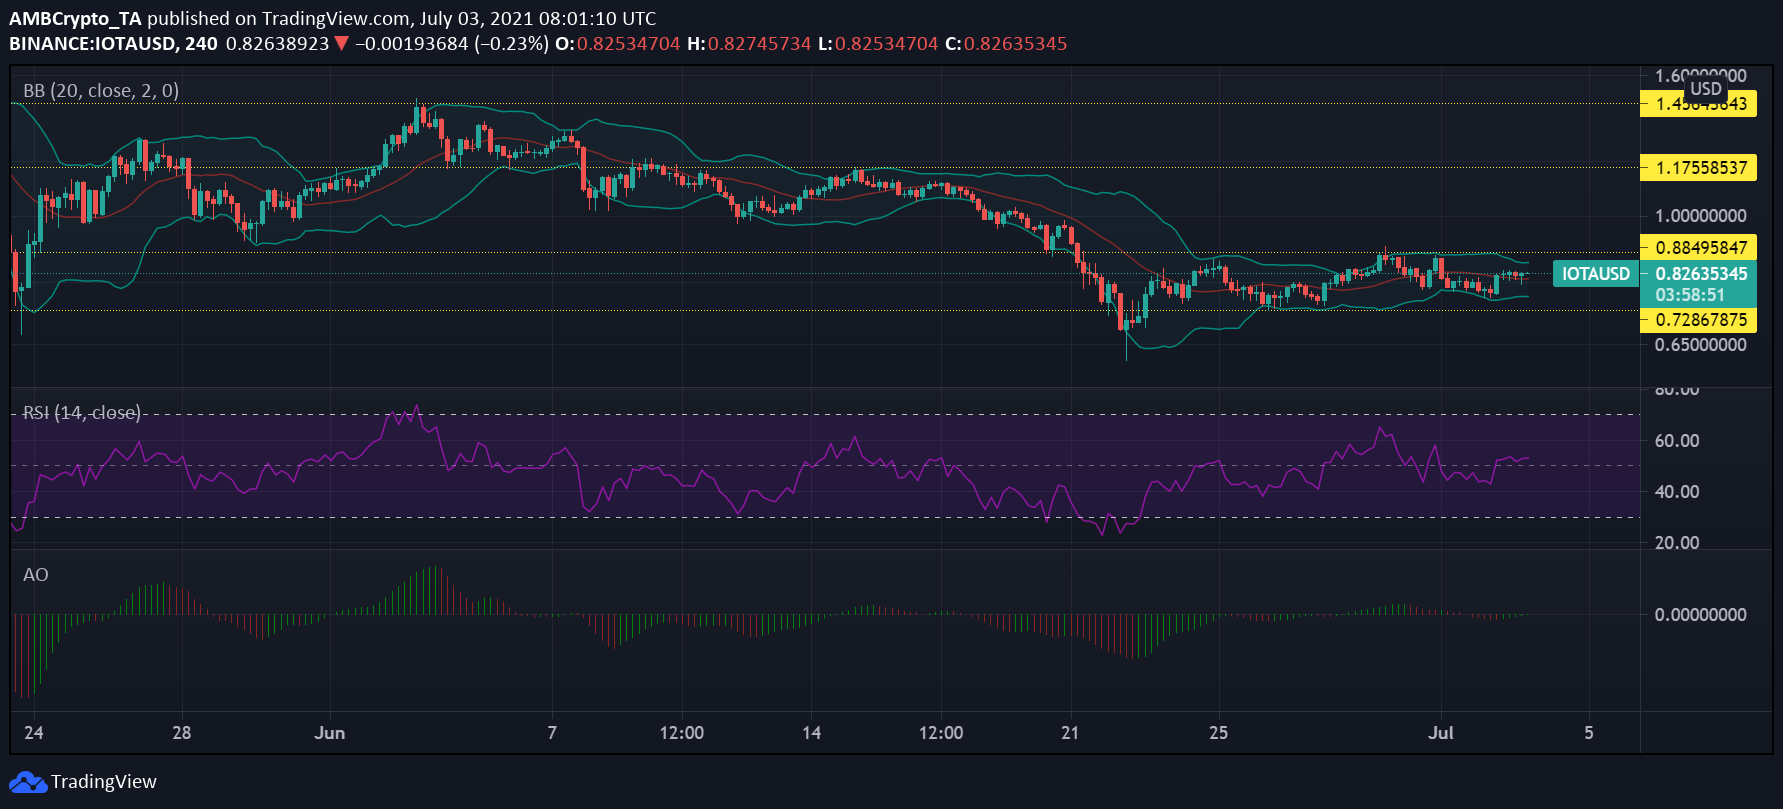
After breaking through the key support at $0.88 on 21 June, IOTA had been sandwiched between the restricted price channel of the former acting as resistance and $0.72 acting as a support level. The alt made gains of 7% over the past day, even as its trading volume increased by a little over 1%. IOTA’s yearly ROI also increased by 84.29%.
The contraption of the Bollinger Bands suggested that market volatility was dying down and price action would remain limited going forward. IOTA’s 30-day volatility was 1.29.
The Relative Strength Index (RSI) was just above the point of equilibrium in neutral bullish territory. It was thus observed that buying pressure was slightly higher than selling pressure.
The appearance of tiny green bars below the Awesome Oscillator’s histogram highlighted the appearance of a bullish signal on the price chart’s momentum.