The how and when of Cardano’s efforts to reverse market trend

Disclaimer: The findings of the following analysis are the sole opinions of the writer and should not be considered investment advice
Cardano, as a blockchain, has seen some quick developments over the past few months. With respect to security, for instance, Cardano announced doubling its bug bounty program on Hackerone in an effort to tighten security in the era of hacks and exploits.
In fact, Messari.io also noted that the Cardano network had more transaction activity (24 hours, adjusted volume) than Bitcoin or Ethereum. Such doses of positive news, while pleasant to read, have not made themselves felt on the charts yet.
ADA- 12 hour chart
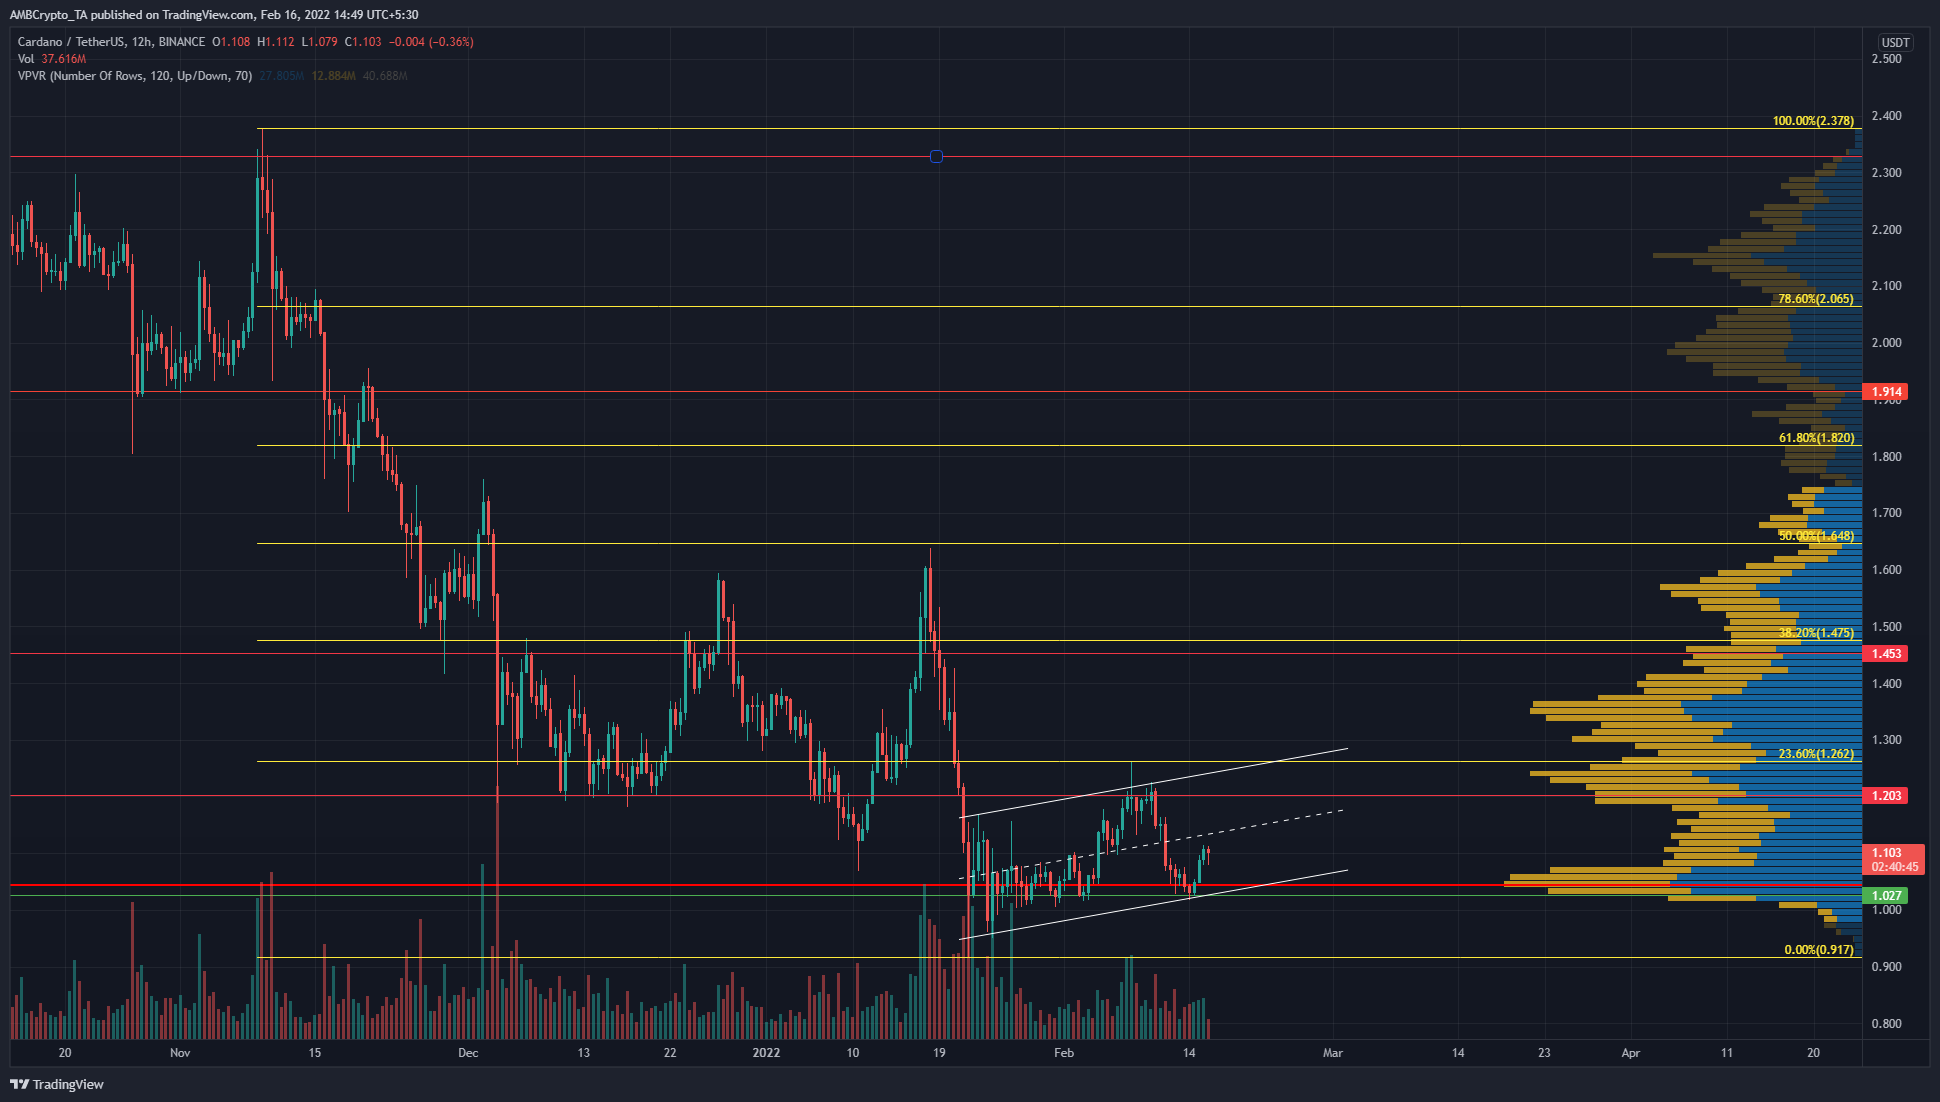
Since November, when the $1.91-level was flipped from support to resistance, the market structure has been bearish. In mid-January, there was a strong pump in the price of ADA from $1.1 to $1.6 in a matter of days. Alas, selling pressure reversed all these gains and then some to make ADA retest $1 as support.
Over the last 30 days, the price appeared to form an ascending channel pattern (white). And, $1 has held in the face of the bears thus far.
The Volume Profile Visible Range tool showed that the Point of Control lay at $1.1, and the price was above this level. According to the VPVR, the next pocket of significant liquidity lay at $1.24 – in between the $1.2 and $1.26 levels of resistance.
ADA would need to move above $1.26 to show signs of bullishness over the longer timeframes.
Rationale
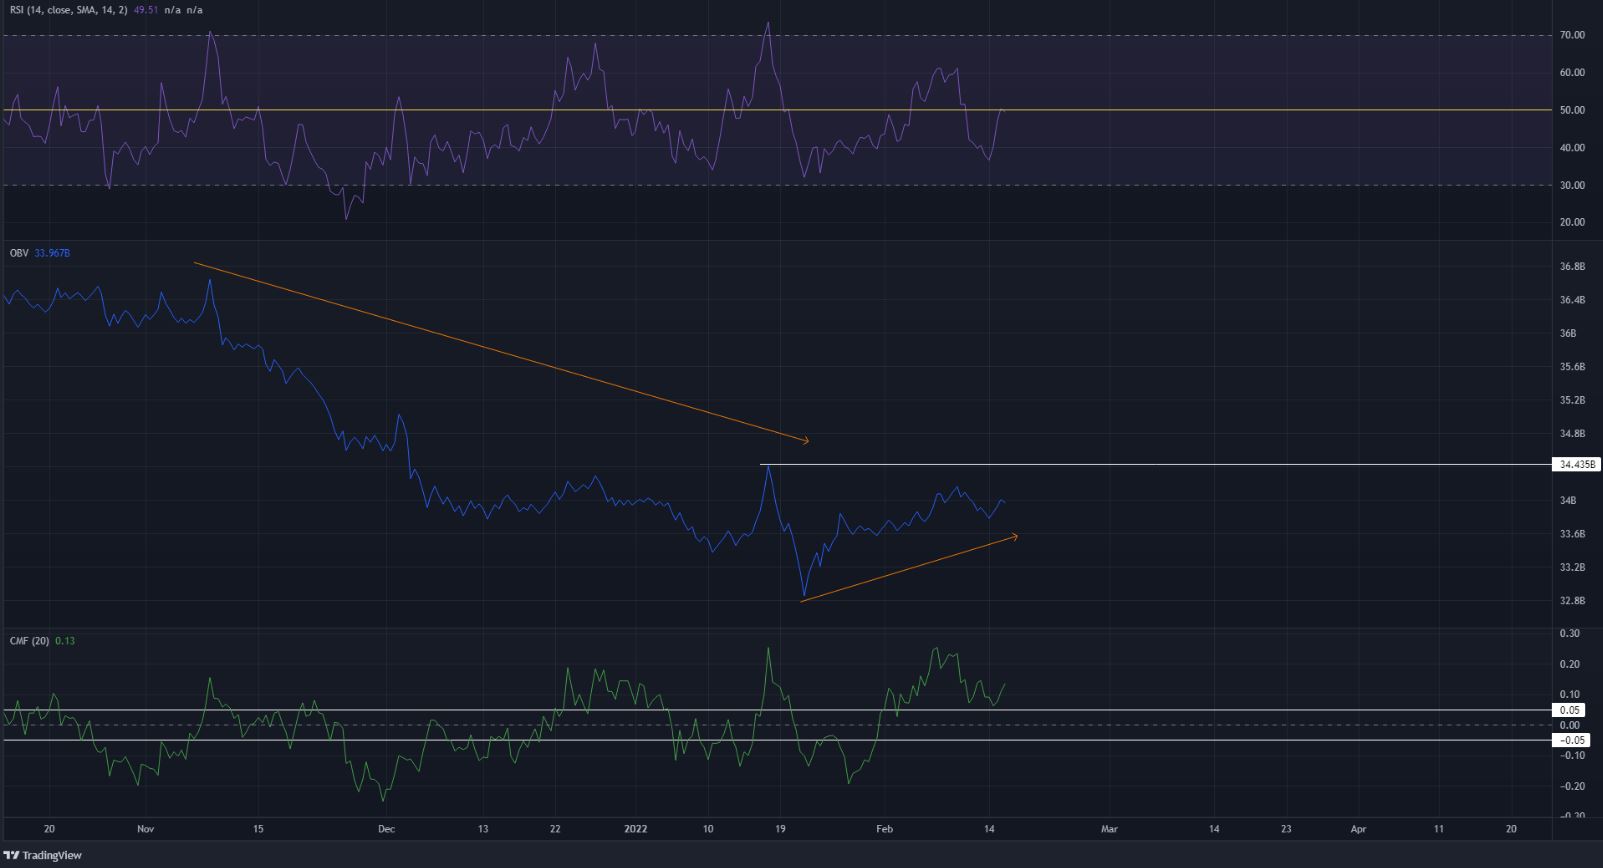
The RSI has been oscillating rather wildly over the past month while the two months before January saw a bearish trend for the most part for Cardano. At the time of writing, the RSI was at neutral 50 once again. However, it might get rejected since the channel’s mid-point could act as resistance in the next few days.
The OBV has also been on a downtrend in recent months, although it has seen some demand arrive over the past month. The Chaikin Money Flow also showed the same thing. There have been capital flows into the market in recent weeks, but the past few months have been neutral or bearish overall.
Conclusion
The $1.26-level would need to be flipped to support for ADA’s next move upwards. The $1.45 and $1.6 areas, if the price can climb to them, can be used as take-profit areas.
Although Bitcoin has been strong recently, it still has significant resistance levels to the north. This means Cardano is unlikely to flip from bearish to bullish on the higher timeframes anytime soon. And, it could take weeks more to show bullish strength.


