The Sandbox demarcated an area of demand, will it revisit these lows again

The Sandbox is one of the more popular metaverse tokens in the crypto sphere. It registered a whopping 400% run in the month of November alone. This run began from an accumulation bottom at $0.5 in October. At the time of writing, The Sandbox was forming lower highs on the daily timeframe. This was not a discouraging sight for bulls who would actually be welcoming the chance to accumulate more SAND at lower prices in anticipation of a future breakout.
SAND- 1D
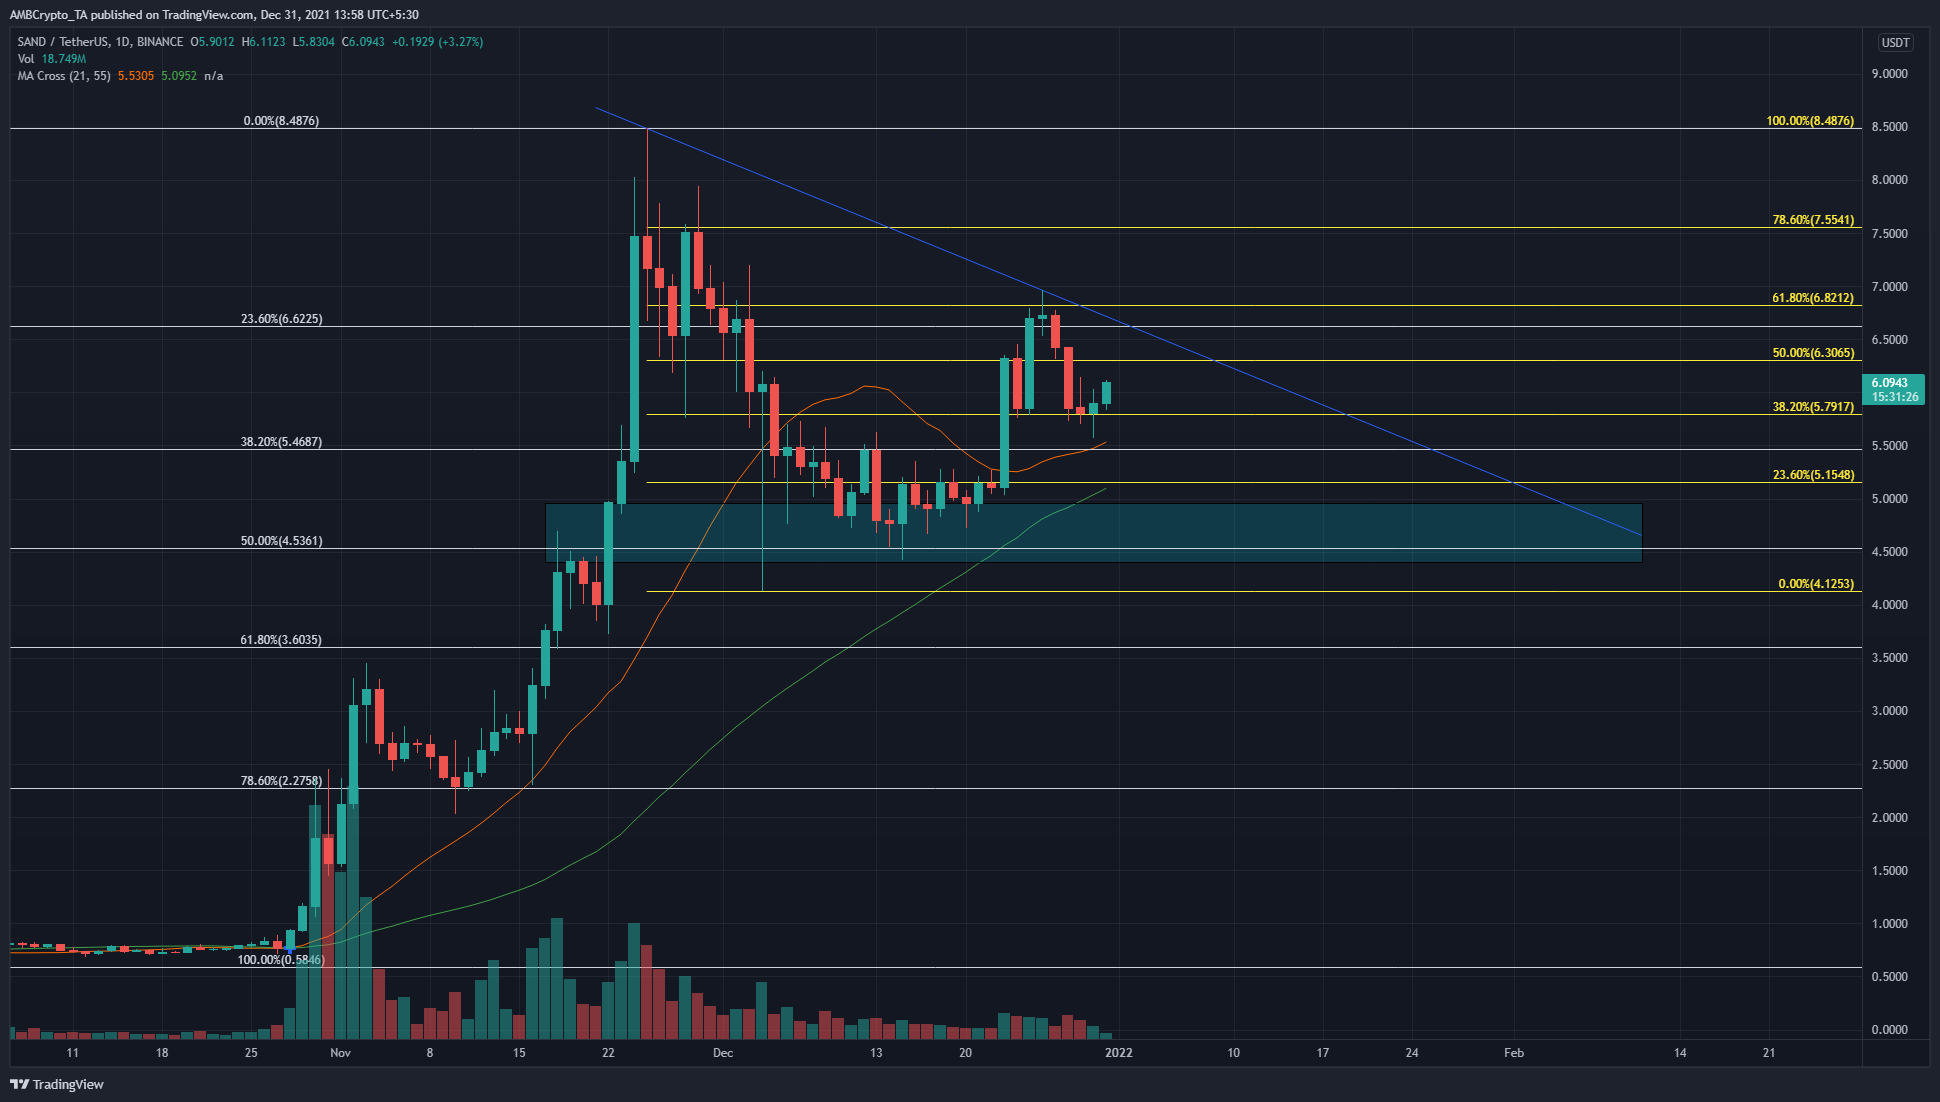
The move from $0.58 to $8.48 (gray), and the pullback to $4.12 (yellow), were used as swing lows and highs to plot two sets of Fibonacci retracement levels. The $6.6-$6.8 confluence between the two sets of levels was an area where SAND found heavy resistance earlier this week. Subsequently, the price was forced to pull back to the $5.79 support level.
The $5.5 level offered resistance to the price earlier in December. A candle wick to $5.56 on 30 December was bought in a matter of hours. Another level of strong significance was the $4.53 level. In November, the price found some sellers there, pulled back to $3.9, and surged past $4.5 on the second try.
The descending trendline (blue) can also be expected to serve as resistance. It was possible that SAND would face another rejection at this trendline over the next month and revisit the $4.5 lows in search of demand once more.
The price continued to move above the 55-day SMA (green), an encouraging sign for buyers.
Rationale
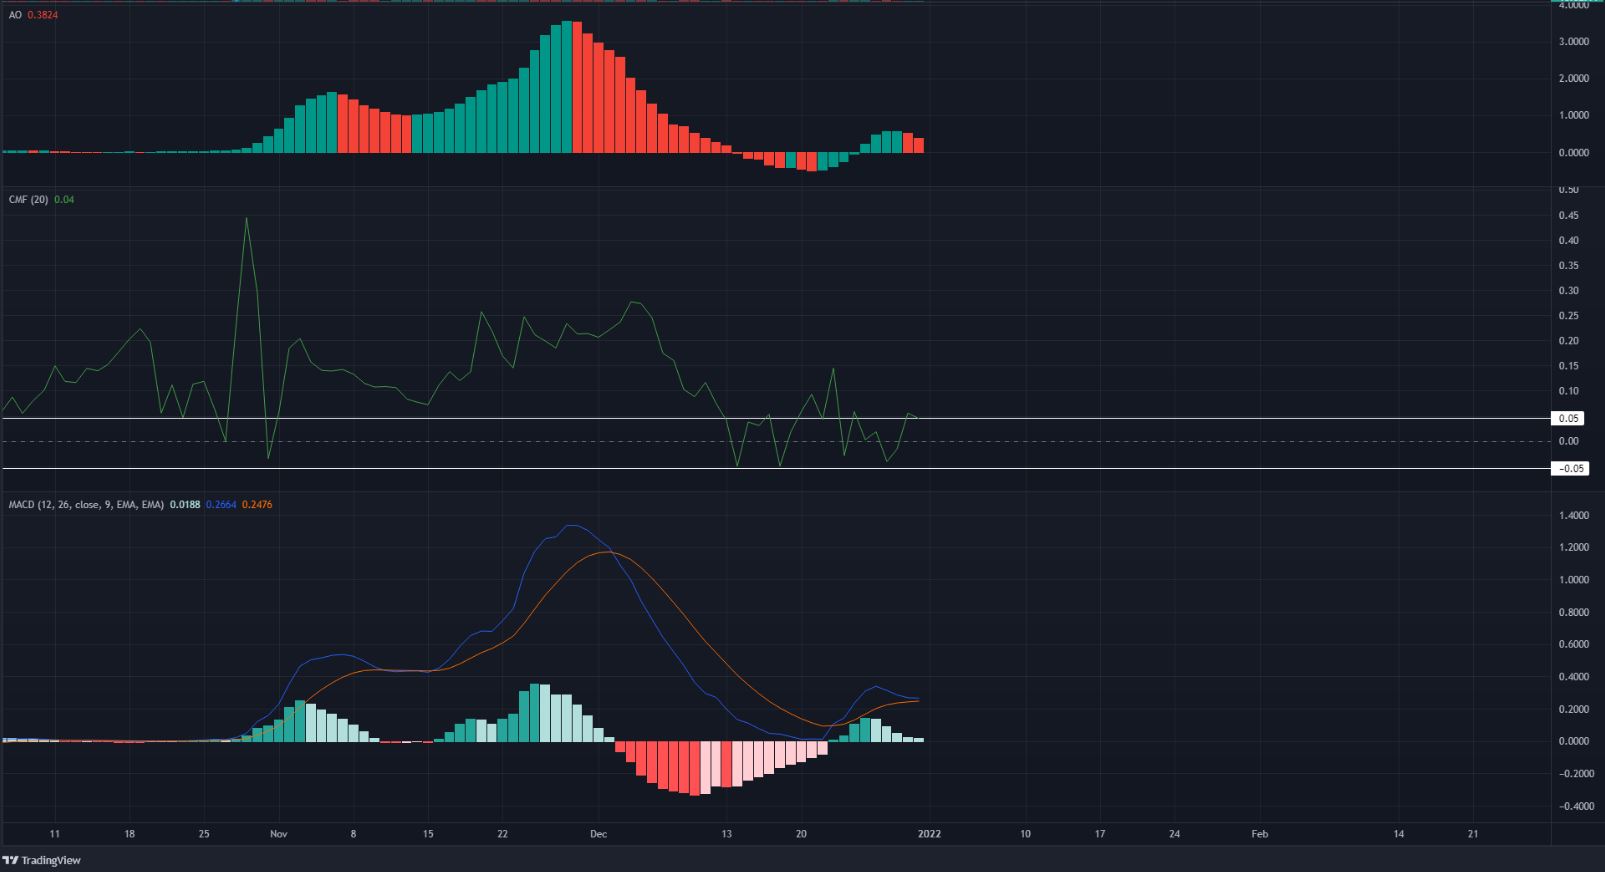
The CMF has been moving between +0.05 and -0.05 for the better part of the past two weeks, with some days of strong buying that saw SAND climb to $6.97 (trendline resistance). This move saw the Awesome Oscillator climb above the zero line as well.
If the CMF closes a session back beneath +0.05, it would indicate that capital inflow and demand had weakened.
The MACD continued to move above the zero line, although it was on the verge of signaling weakening bulls by forming a bearish crossover. The momentum, if it continued to weaken, would once more point toward sideways trading for SAND on higher timeframes.
Conclusion
The $5.5 level and the $4.5 area have been highlighted as areas where buyers would be interested in stepping in with strength. The descending trendline combined with the $4.5 support, appeared to form a triangle pattern. The price, if it coils within this pattern, could see a breakout to the upside once again, provided bears are unable to claim the $4.5 level as their own.


