These 3 key metrics indicate that the current Bitcoin rally is most likely to…

In less than a week’s time, Bitcoin’s price has managed to surge from $37.5k to $46.3k. Keeping in mind the recent surge, many from the community remain fairly optimistic about the king-coin’s bullishness. Nonetheless, one section believes that this is merely a fake-out rally. So, which argument holds true at the moment?
SOPR and MVRV
Spent-output-profit-ratio provides an insight into the degree of realized profits and losses. The aSOPR, for that matter, represents the whole market while the STH-SOPR represents only the profit or loss of short-term-HODLers. After remaining below the 1-line for more than a couple of months, both SOPR metrics have started exhibiting signs of a textbook bullish reversal.
Looking at the local-high level attained by the aSOPR recently, one can infer that profitable coins took advantage of the market strength to realize profits. With the metric hovering back around 1 again, it can be said that the profitable coins are no more being spent and conviction has found its way back. Additionally, it should be noted that the STH-SOPR has always remained lower than the aSOPR and that is indicative of the fact that short-term HODLers have been realizing more losses when compared to their other counterparts.

Now, the following two scenarios can be expected to unfold in the coming weeks:
If the SOPR continues to inch higher, it would mean that the marker is able to absorb all the profits realized on spent coins. This, in turn, would intensify the bullish narrative. However, if this metric stumbles and hovers below the 1 line for an extended duration, it would outrightly imply that the recent price uptick was merely a fake-out rally. Hence, it would remain crucial to see whether or not we get a bullish confirmation in the coming days.
The MVRV or the market-value-to-realized value too, at the time of writing, stood above 2 and indicated that investors are making more profits than usual in the market. Now, even though the current state of the aforementioned metrics project fairly bullish signals at the moment, does Bitcoin have the support of market players?
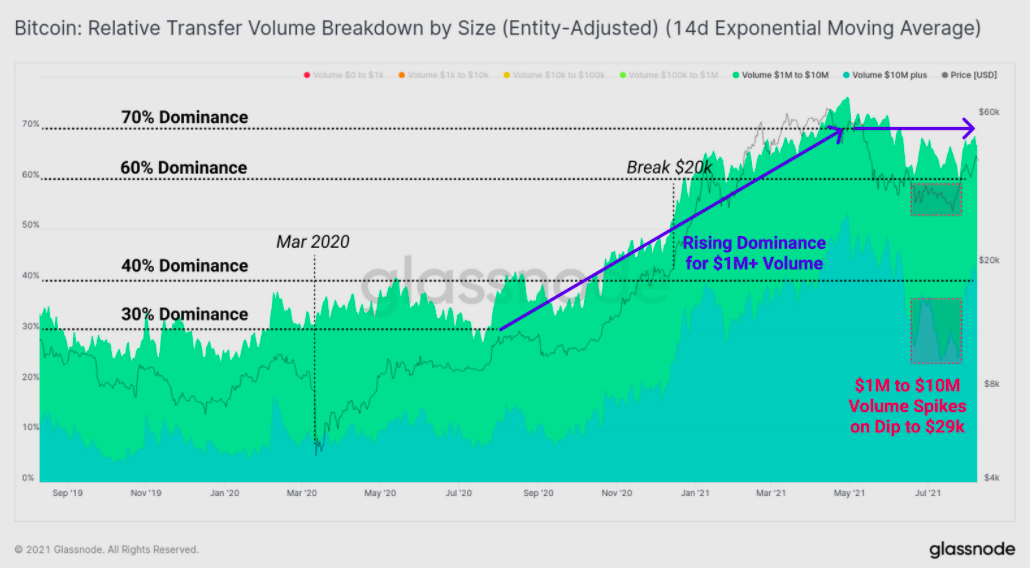
Dominance
The dominance of large transactions has evidently been increasing in both the macro and micro timeframes. Since September last year, the dominance of these large size transactions has risen from 30% to 70% of the total value transferred. As far as the near-term is concerned, the $1 million to $10 million transaction group witnessed a notable spike when Bitcoin’s price was oscillating in the lower $30k region in late July. Additionally, last week, the dominance of the $10 million+ volume category witnessed a notable 20% dominance spike and thus sustained the BTC’s rally.
Moreover, the market has also been witnessing a structural decline in the dominance of small size transactions. Transactions less than $1 million in size have notably declined from 70% dominance to around 30%-40% dominance over the past year.
The aforementioned metrics, in conjunction, highlight a new era of institutional dominance. Historically, whenever new entities have come into the picture, Bitcoin’s price has substantially rallied and looking at the recent spikes in their dominance, it can be said that the rally is most likely to intensify and prolong itself.