These are the next target price levels for Ethereum

Ethereum the undisputed king of the altcoin market finally breached its previous ATH of $4380 and pushed through the $4,400 mark making a new ATH on 29 October, 2021. With ETH achieving a new all-time high the market’s anticipation of the coin’s future price movement heightened.
While a recent survey by Finder has predicted Ether’s long-term price movement, forecasting a 10-year price target of over $50K, as reported in our recent article, at this point it is crucial to establish a more realistic mid-short term targets for ETH. This article will delve into the same and look at ETH’s trajectory that led to an ATH.
FOMO still missing
Ethereum’s price action was closely mimicking Bitcoin’s in the sense that Ethereum broke out from a monthly range of its own. The Ethereum 2.0 Altair Beacon Chain update had a successful start, as 98.7% of nodes upgraded within 24-hours. Notably, a successful Altair upgrade to the Beacon Chain was a stepping stone to the merge with the Ethereum mainnet and the transition to a proof-of-stake (PoS) consensus mechanism in Ethereum 2.0.
That, however, wasn’t all, Ethereum’s success was also driven by the platform’s use in the booming decentralized finance and nonfungible token sectors. At the time of writing, ETH’s Defi total value locked in USD was at $102.61 billion. However, it was evident that trade volumes for Ethereum have still maintained below-average levels which were signs of a lacking retail FOMO.
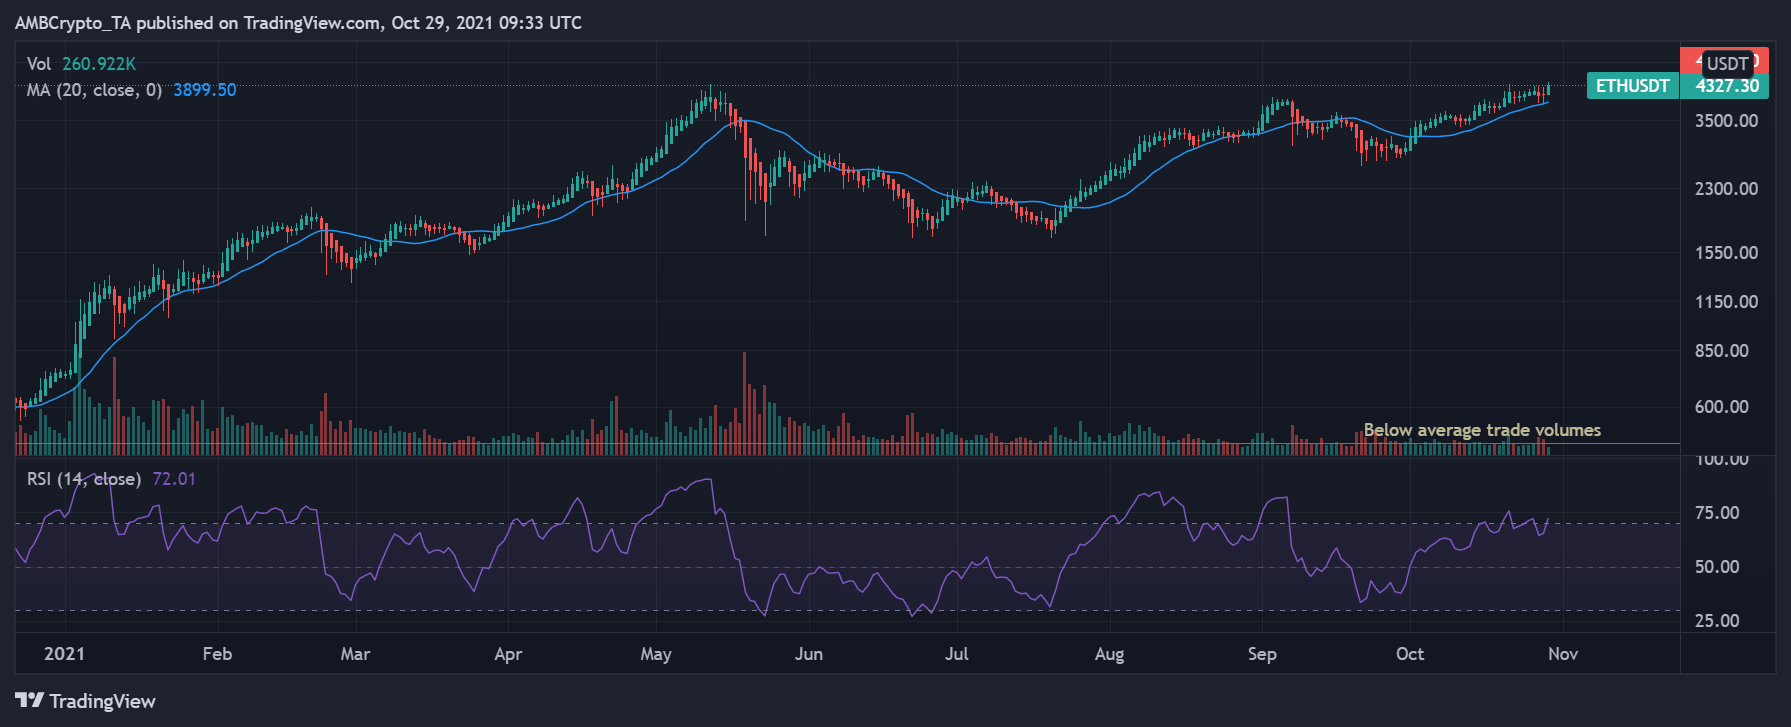
Notably, a similar lacking retail FOMO was seen by BTC too and while this was worrisome it was also indicative of the fact that these ATHs aren’t the yearly tops for the two coins and they have more room for growth.
There’s more to it…
With HODLers displaying major conviction over the past few weeks, Ethereum exchange reserves have dropped down to 2018 levels. At press time, the percent balance on exchanges had dropped down to 12.36% on all exchanges.
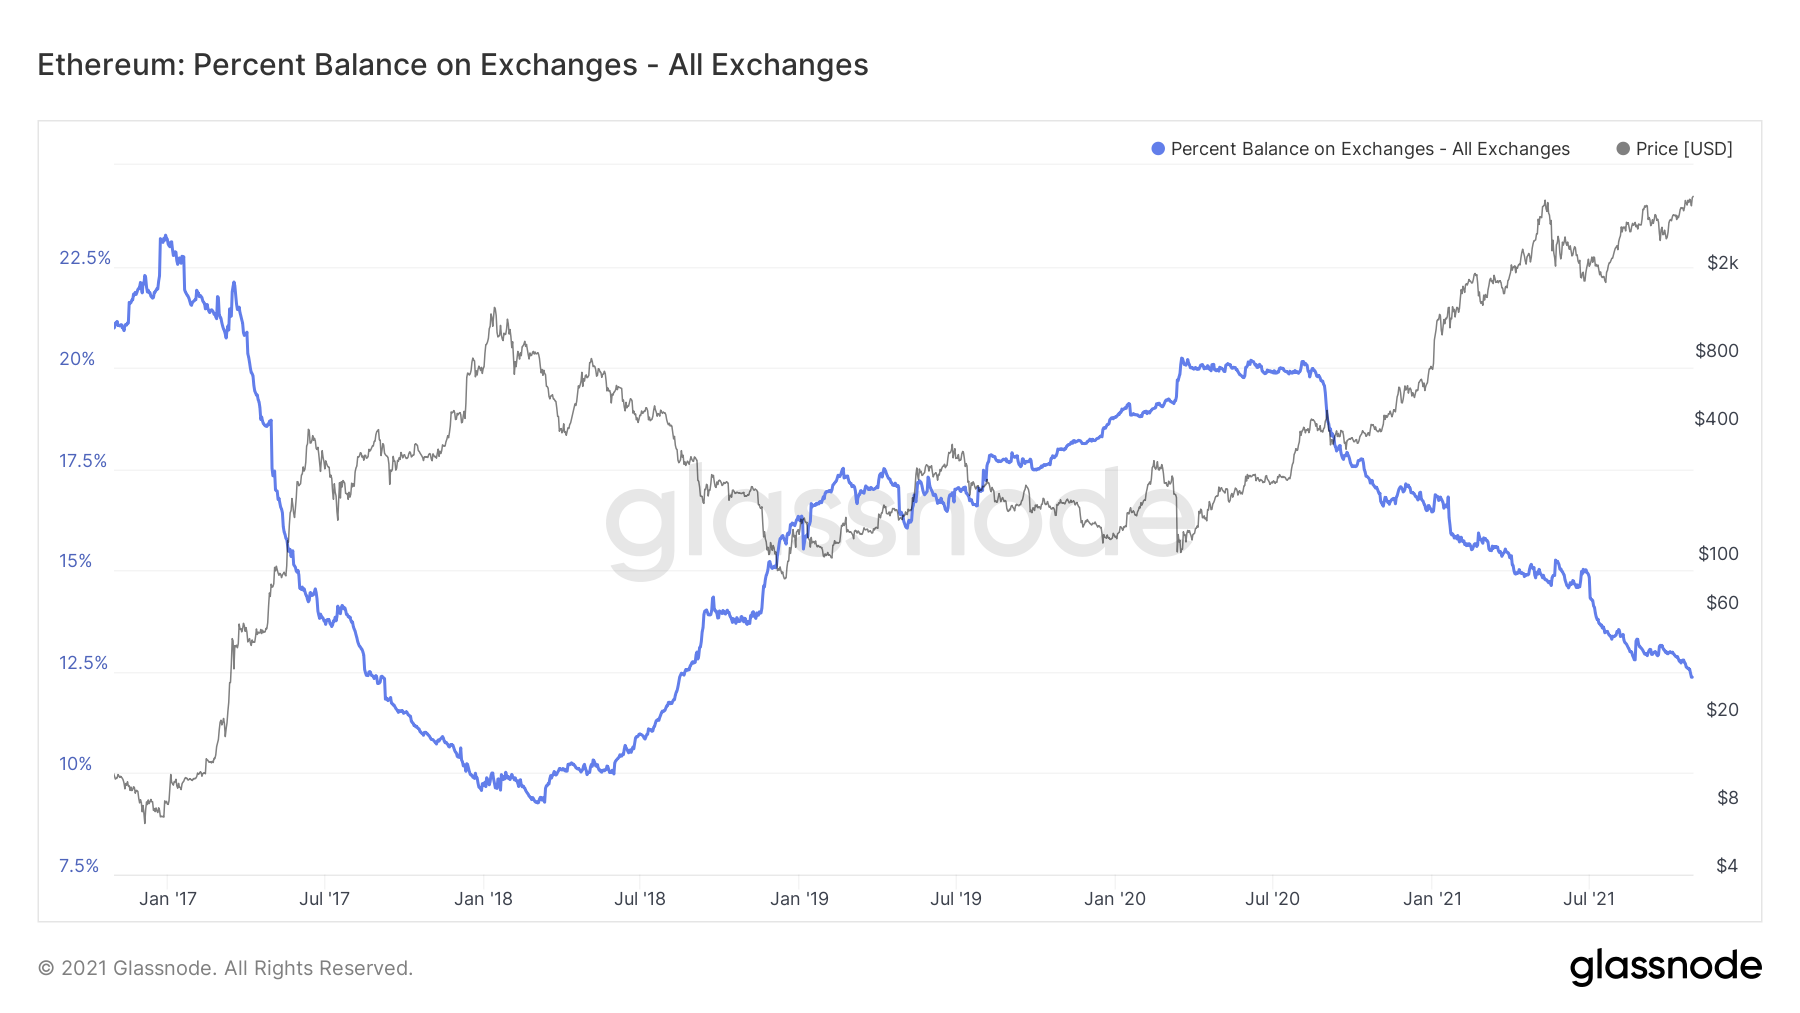
It can be inferred that selling pressure has dropped down significantly, especially as ETH hit a new high. The incentive to sell higher is much more than selling at the present price. Additionally, Ethereum’s percent supply in profit at an ATH again after May, with 99.981% supply in profit at the time of writing. The percentage of circulating supply in profit presents the percentage of existing coins whose price at the time they last moved was lower than the current price.
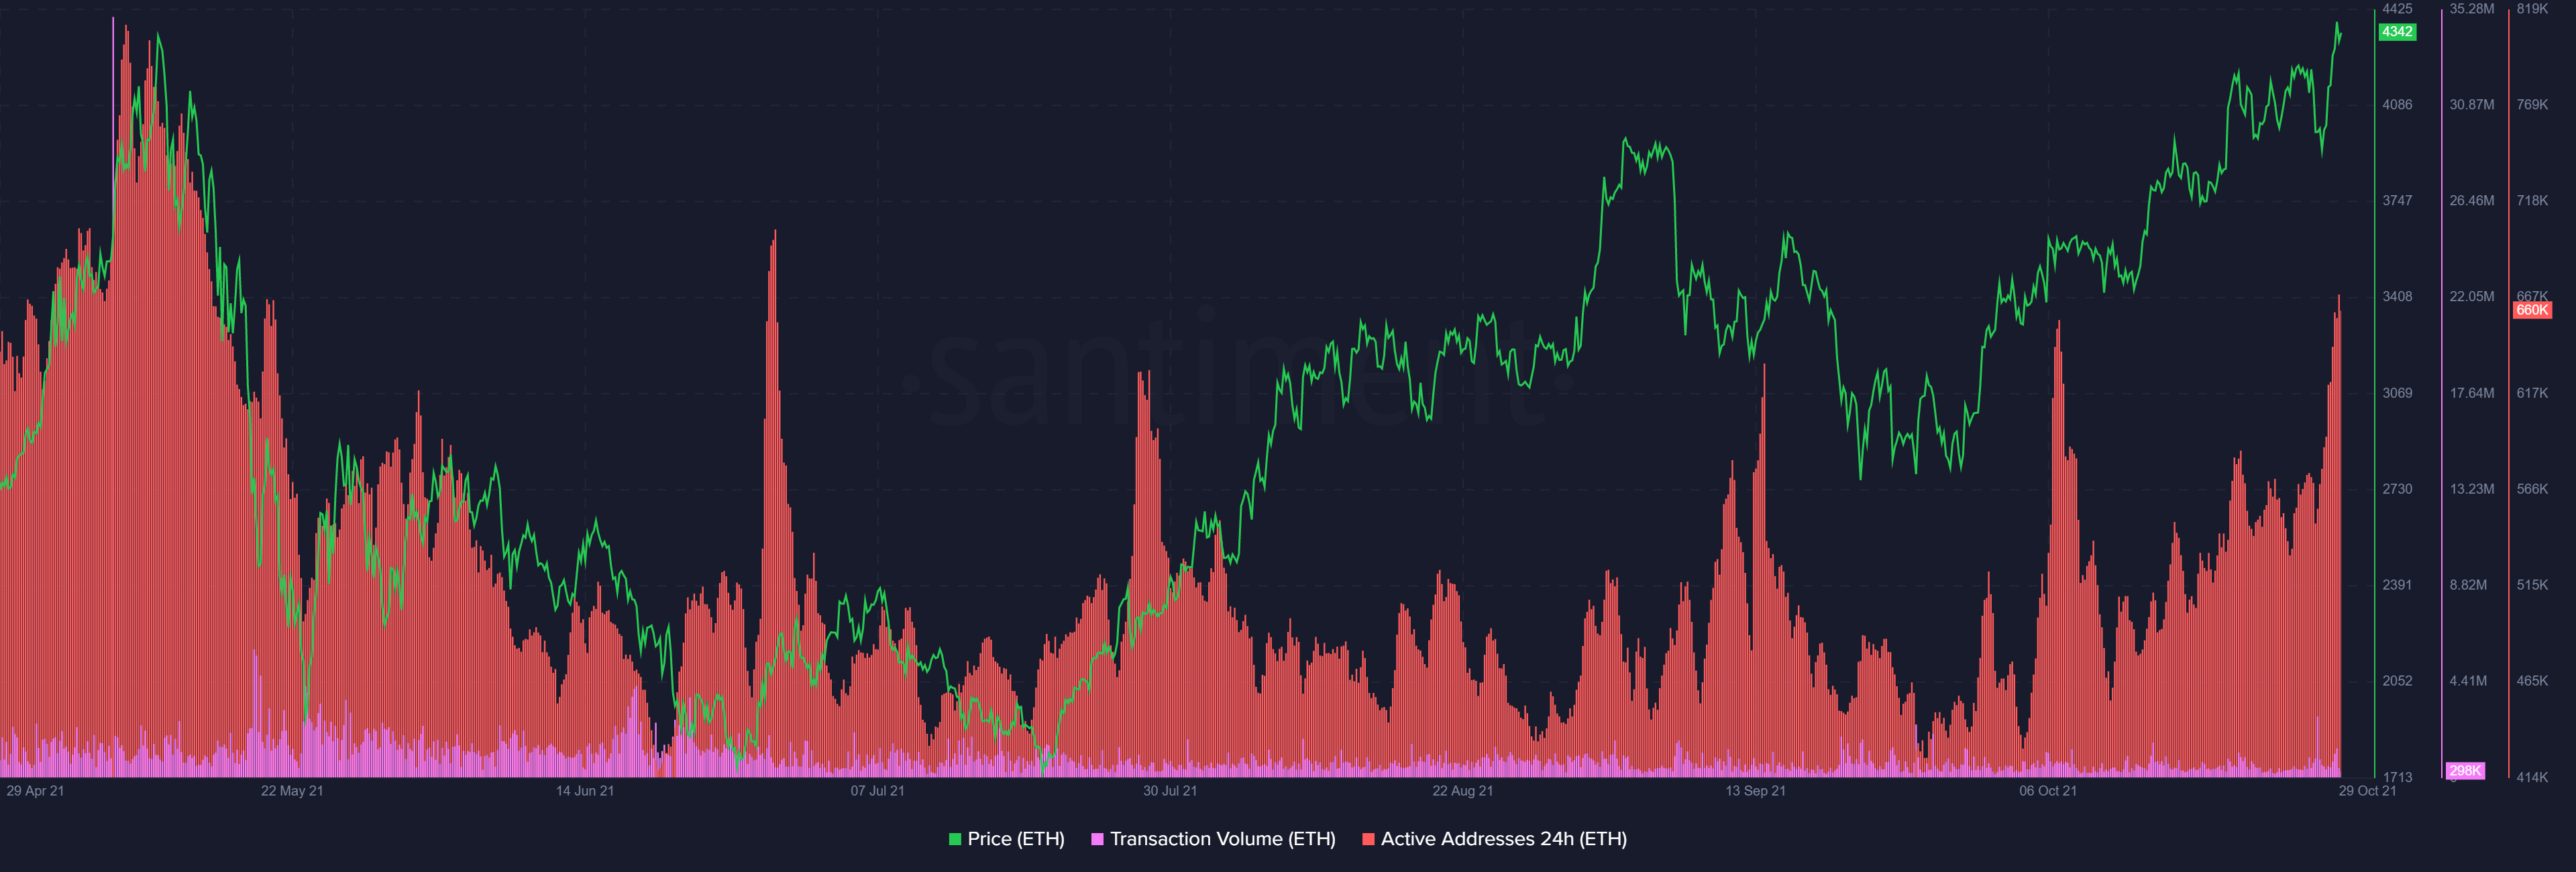
That being said, transaction volumes noted large transactions at press time alongside a high number of active addresses. Further, ETH’s network growth metric also noted a major uptick signifying a healthier network.
The October monthly expiry was a strength test for bears, as ETH closed above $4,000 making an ATH a more than $205 million profit was ensured for ETH bulls, confirming a bullish trajectory for the asset.
The 123.6% and 138.2% Fibonacci levels could be potential destinations over the coming week, with the 161.8% Fibonacci level serving as more of a long-term target. Notably, the 161.8% Fibonacci level is at the $6037 mark. Before that, ETH could make a pitstop at $5013 and $5404, which can act as more realistic targets for the top altcoin.