What will it take for Cardano to reach for the $2.14 – $2.23 zone once again

Although Cardano drifted within a tight channel in October, sellers have managed to bust open the cracks in the market. The period between 27 October-28 October, saw ADA shed nearly 13% of its value due to a symmetrical triangle breakdown, before a broader market recovery rescued the alt from monthly lows.
Despite some buy signals emerging on the MACD and Awesome Oscillator, ADA needed to retake key zones before falling back within a bullish-bias.
ADA 4-hour Chart
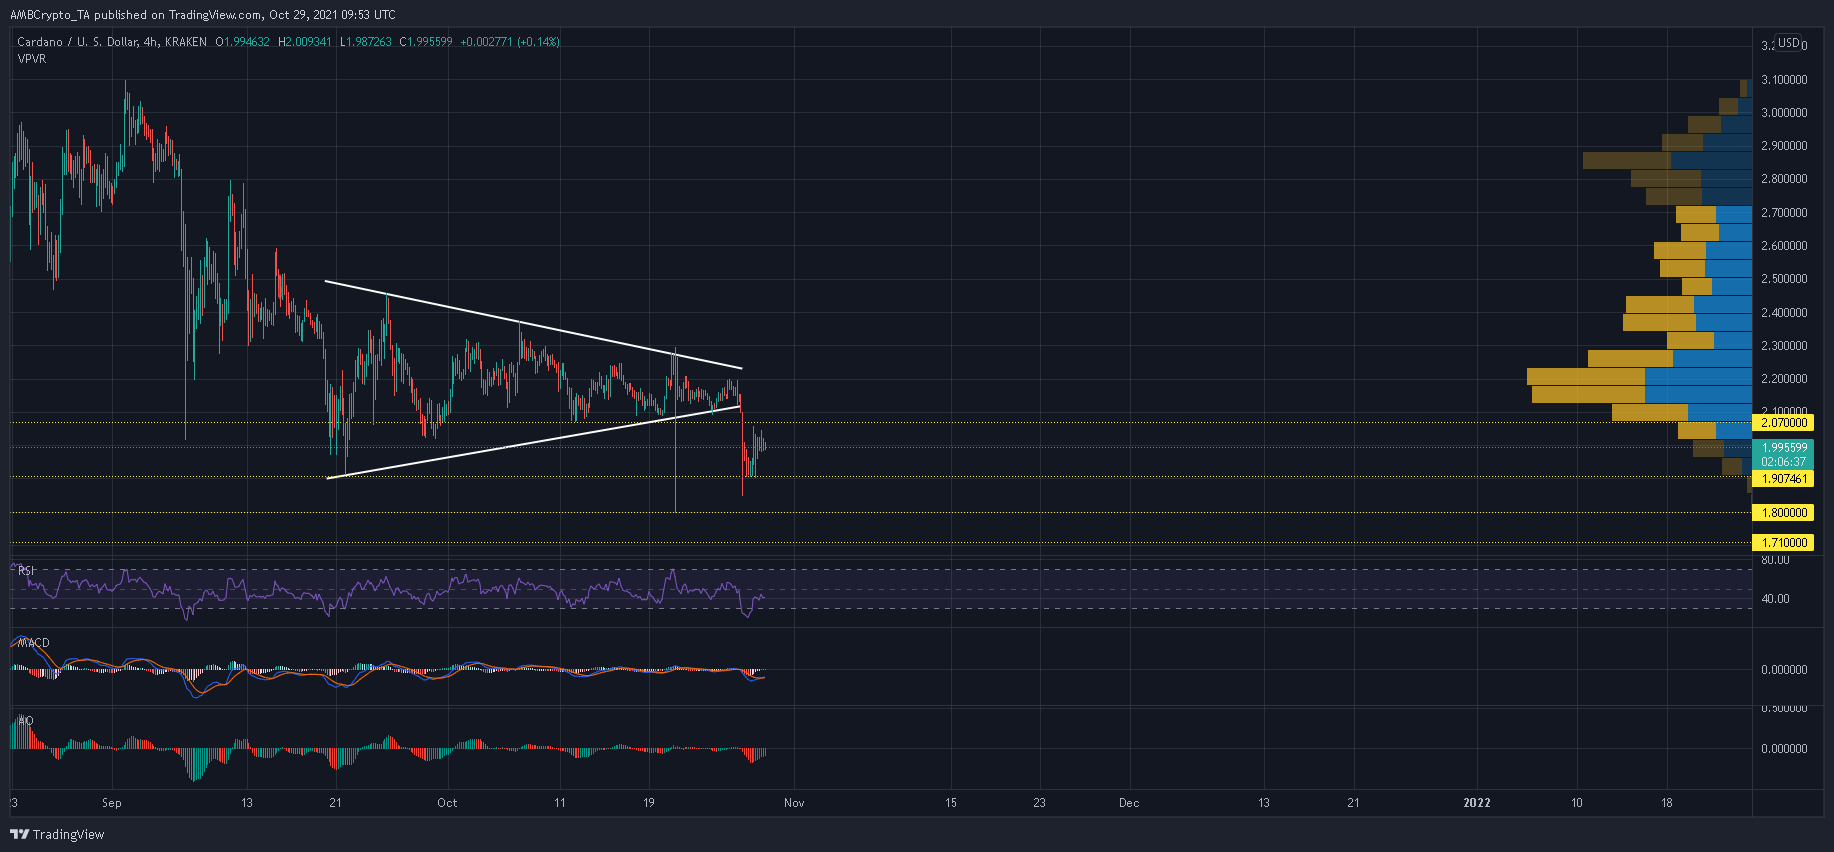
ADA lined up a possible 20% decline from a symmetrical triangle setup which lasted for the entirety of October. As ADA slipped beneath the critical $2.07-mark, sellers managed to initiate a breakdown from the pattern. Although ADA was yet to meet its target around $1.70, an early pushback offered at $1.90 allowed ADA to regain $2 over the past 24 hours. From here, a rise above the 20-SMA (red) and $2.07 would enable ADA to ground its feet at a strong support and hunt for higher price levels.
However, the Visible Range Profile indicated that ADA faced a large amount of sell pressure between $2.14 and $2.23, which meant that its journey upwards would not be so straightforward. Once ADA does make headway within the aforementioned region, expect another period of consolidation before a clearer trend emerges. Should ADA make its way above $2.46 at any given point, expect bulls to be in the driving seat and challenge $2.90 instantly.
On the flip side, ADA would continue its descent to$1.80 should it close below $1.90. The lack of strong support levels below $1.80 could even see ADA shed value all the towards $1.70 before any pushbacks take place.
Reasoning
According to ADA’s indicators, the alt had fared the worst and was now on a path to recovery. The RSI bounced back from the oversold region and headed towards the mid-line. A move above 50-55 would be a sign of strength in the market. Meanwhile, a bullish crossover on the MACD and consecutive green bars on the Awesome Oscillator lined up a favorable near-term narrative as well.
Conclusion
ADA could trade close to $2 as selling pressure gradually recedes from its market. Should buyers capitalize on some buy signals present along the indicators, ADA could make its way above $2.07 and target the $2.14-$2.23 zone once again.


