Key ETH observations that could dictate your next market move

- ETH sell pressure drops to a monthly low as the market loses volatility.
- A lack of bullish momentum confirms that the bears are still waiting on the sidelines.
Ethereum’s native currency ETH has been relatively dormant for almost two weeks during which it delivered some sideways activity. This performance may not last for long as ETH might be about to regain volatility according to this new data.
Read Ethereum’s [ETH] price prediction 2023-24
The latest data from Glassnode revealed that ETH bears were losing grip over the market. This may create an opportunity for the bulls to dominate. But are the bulls ready to take over?
First, let’s take a look at some of the latest market observations that may offer insights into the market’s next direction. The latest Glassnode data revealed that the amount of ETH flowing into exchanges was at its lowest level in the last four weeks. This can be translated as a drop in sell pressure.
? #Ethereum $ETH Exchange Inflow Volume (7d MA) just reached a 1-month low of $11,224,406.65
Previous 1-month low of $11,740,219.01 was observed on 19 May 2023
View metric:https://t.co/1UqsIRQu7N pic.twitter.com/ISV7jbC5ih
— glassnode alerts (@glassnodealerts) May 22, 2023
In addition, Glassnode data also showed that more ETH holders were staking their coins. As a result, the total value locked in ETH 2.0 deposit contracts has been on the rise and it recently soared to a new ATH. In other words, more ETH holders were significantly confident in locking up their ETH, which signified a long-term focus.
? #Ethereum $ETH Total Value in the ETH 2.0 Deposit Contract just reached an ATH of 21,750,259 ETH
View metric:https://t.co/SzbMPqvhlb pic.twitter.com/72Ce5baIBz
— glassnode alerts (@glassnodealerts) May 22, 2023
ETH bulls fail to capitalize on the current opportunity
These findings may offer a favorable outlook but only if there was corresponding demand. Our first go-to could be ETH whales which have been offloading some ETH in the last seven days.
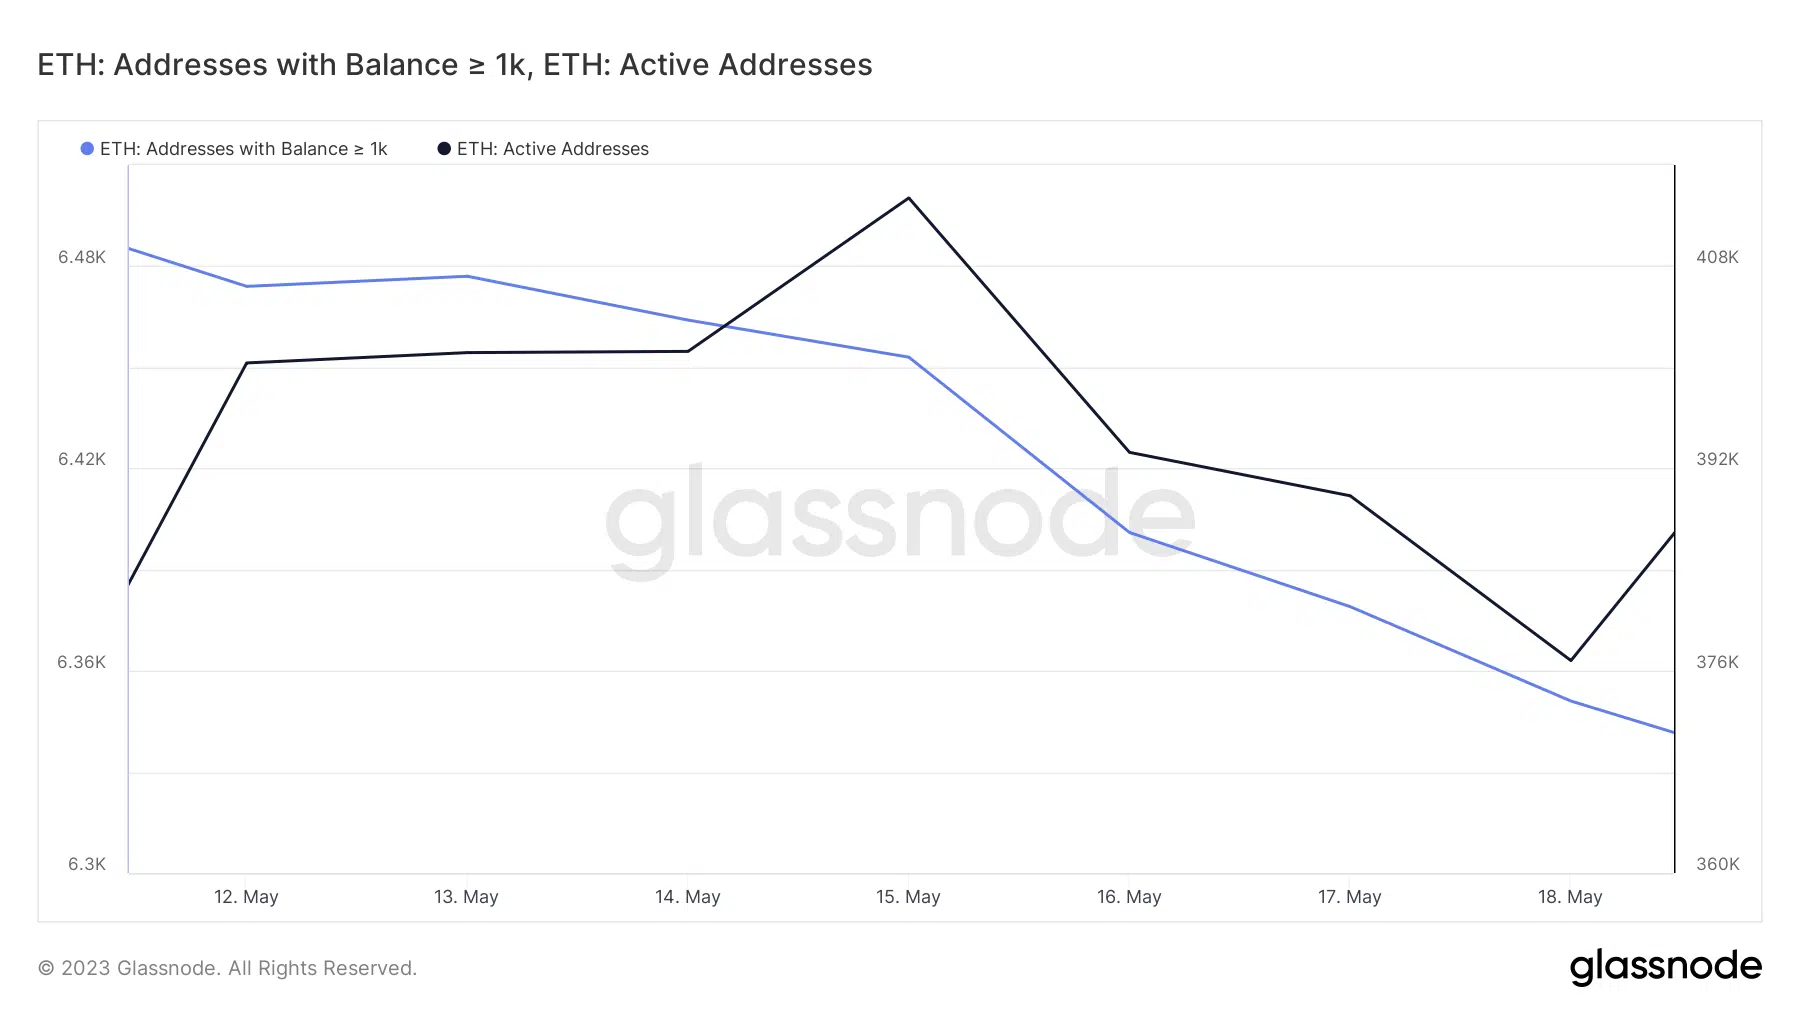
Addresses holding at least 1000 ETH have been on the decline during this period. The number of active addresses also dropped especially since mid-May. However, data showed that addresses were now regaining activity which may be the first sign of upcoming volatility.
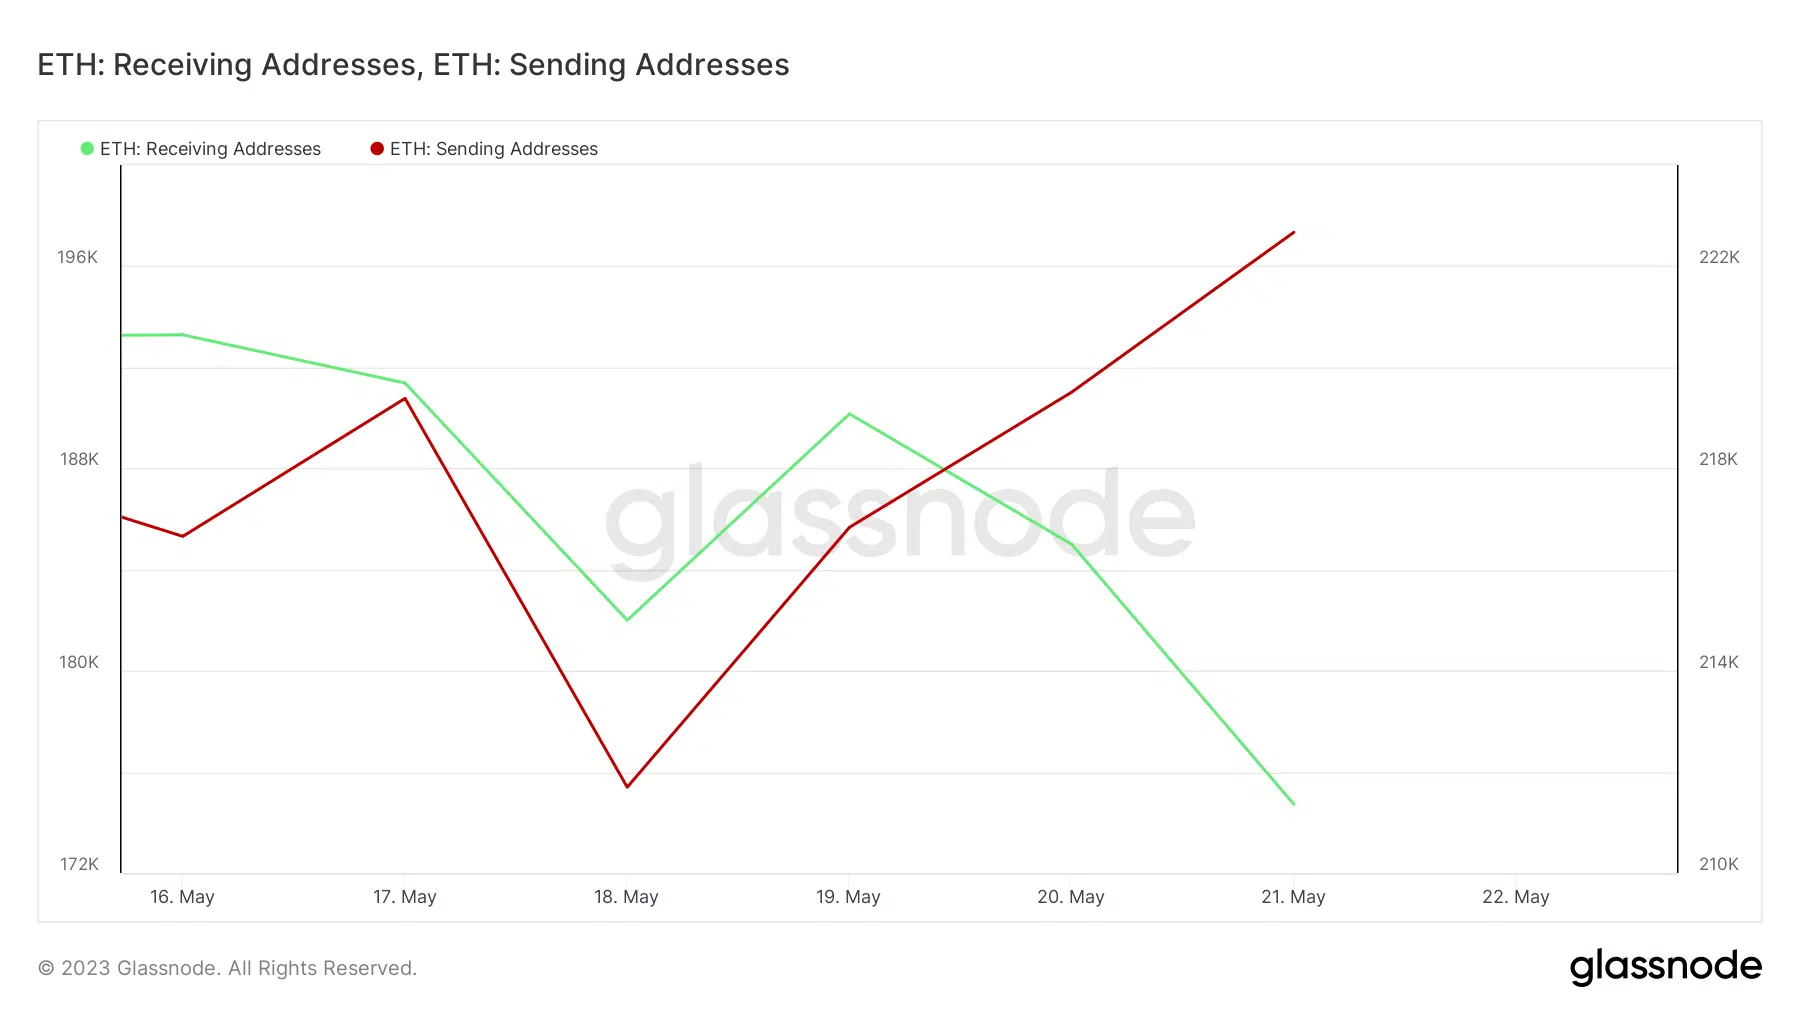
The address flow painted a glim image for the bulls. Receiving addresses were lower between 19 and 21 May, reflecting lower bullish demand. Meanwhile, there was a surge in the number of sending addresses between 18 and 21 May, indicating that the ratio of buying vs. selling pressure was still in favor of the bears.
Based on the above findings, it was clear that there was still a lot of uncertainty in the market on both sides of the divide (bulls and bears). ETH’s derivatives metrics demonstrated a similar outcome.
Is your portfolio green? Check out the Ethereum Profit Calculator
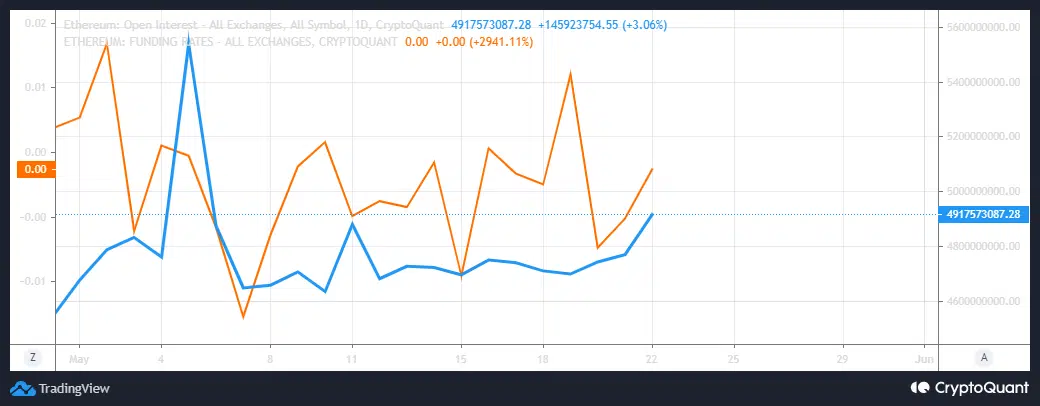
ETH’s open interest in the derivatives market has been sideways for most of May. So far it does not indicate any noteworthy change. Similarly, ETH’s funding rate confirmed the lack of excitement in the market.
Based on the above findings, ETH metrics didn’t exactly offer any concrete signs of a directional pivot. However, a return of directional volatility could still occur this week given the fast-paced nature of the crypto market.


