THETA, Chainlink, Ethereum Price Analysis: 23 April

The altcoin market continued to illustrate the significant influence Bitcoin has on it. BTC fell below the $50k price level and it didn’t take too long for the remainder of the market to mirror its losses. For the largest altcoin in the market – Ethereum this resulted in a 15 percent price drop right after it traded at an ATH.
Theta
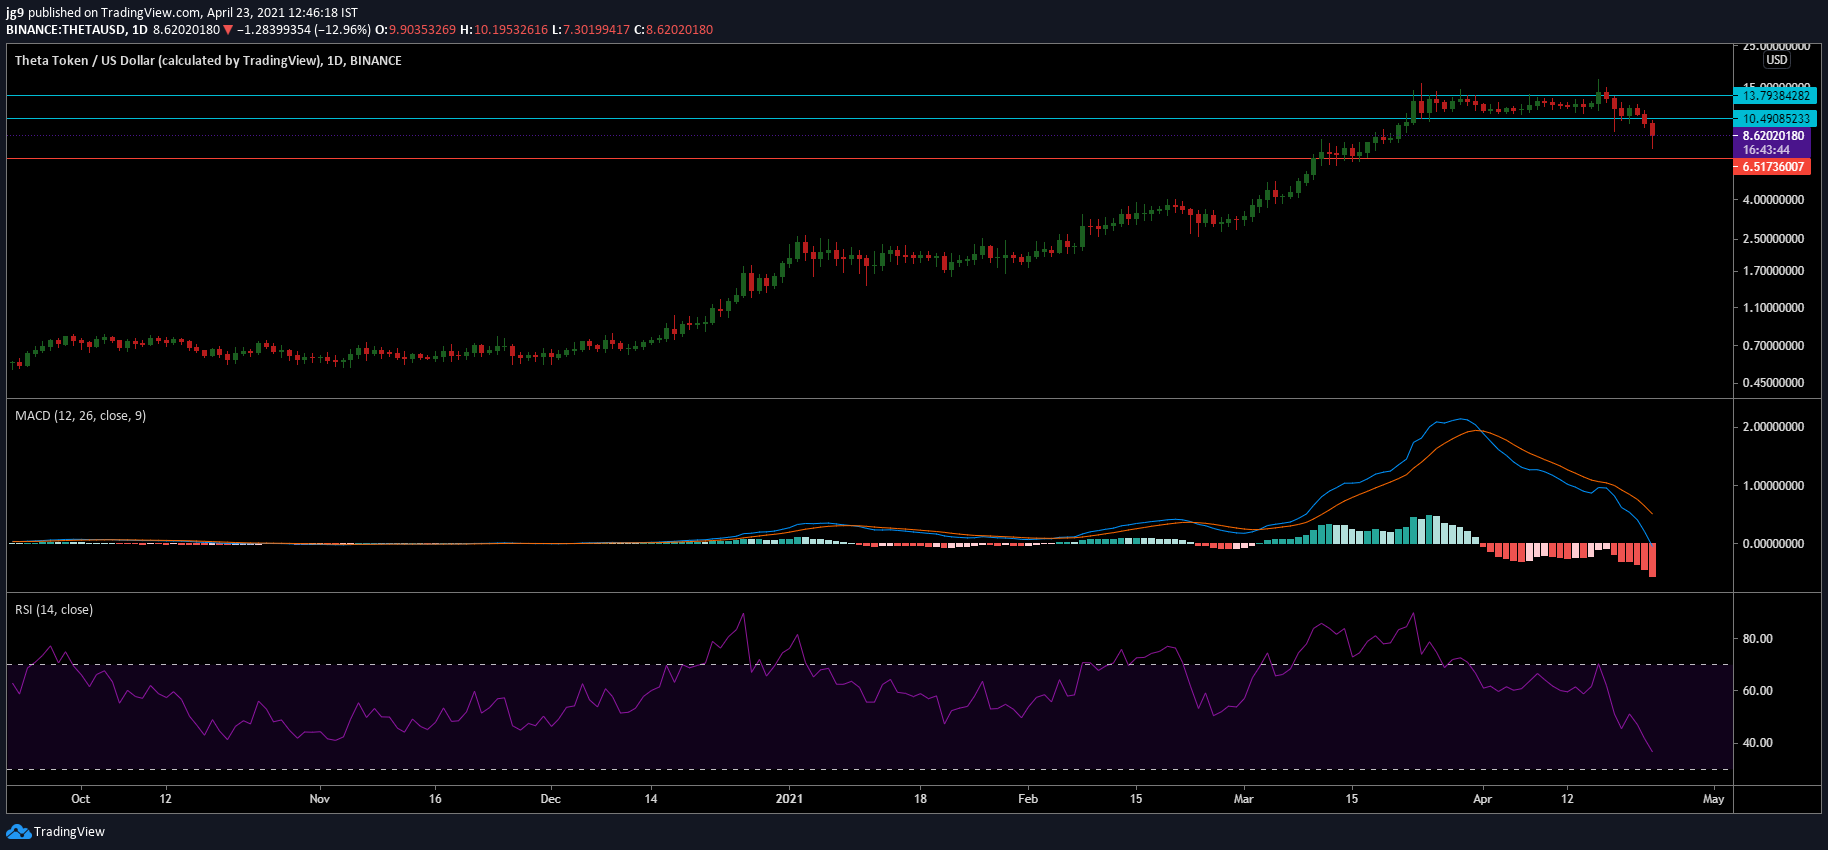
Theta’s price fell by 25 percent and was trading at $8.4 with a market capitalization of $8.2 billion making it the 18th largest cryptocurrency in the market. If bearish pressure were to continue, Theta may soon be testing its immediate support at $6.5. However, if a trend reversal were to take place, the coin will have to breach the $10.4 price level which is likely to offer significant resistance.
The technical indicators highlight a very bearish outlook for Theta in the coming week. MACD indicator had undergone a bearish crossover and a reversal may take a bit of time. RSI echoed a similar verdict as it was in the oversold zone.
Chainlink [LINK]
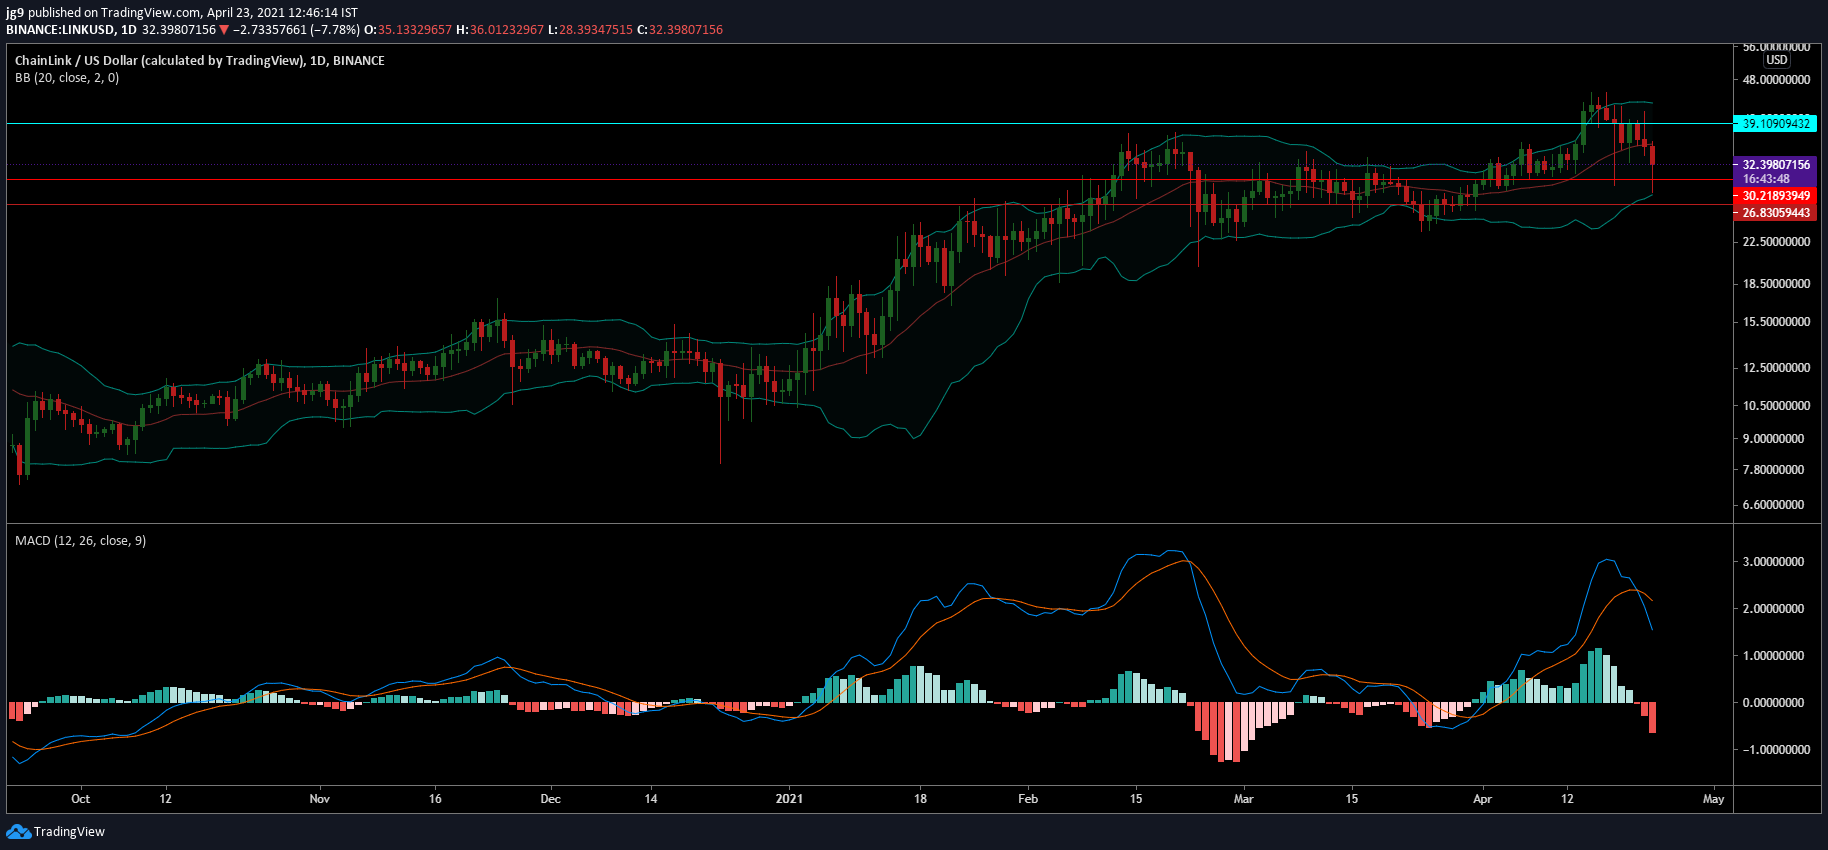
Chainlink’s price has seen increased volatility in the past two weeks and has been on a downtrend since April 15. The past few days amplified the bearish sentiment and the coin currently trades at $32.1 and was very close to testing its immediate support at $30.2.
Between the $30 and $26 price levels, the coin has a strong support range and may help arrest the downtrend the coin is currently in. There is strong resistance at $39 if the coin were to see a recovery.
Bollinger Bands continued to expand and indicated higher volatility levels in terms of LINK’s price action. MACD indicator underwent a bearish crossover and a reversal may not take place in the coming 24-48 hours.
Ethereum [ETH]

Ethereum lost close to 15 percent in the past day and was trading at $2216. The coin has two strong support levels at $2097 and $1894, if the bearish pressure were to continue and push the coin further down. However, if a bounce back were to take place, ETH may move toward resistance at $2546 – however, such a move isn’t very likely in the short term given the present market scenario.
MACD indicator has undergone a bearish crossover with the signal line moving above the MACD line. Stochastic indicator was in the neutral zone after having seen a significant portion of its buyers leave the market.