
$1.20 retest possible if VIRTUAL bears take control – More inside

MATIC bulls have been busy in the market after a long intermission. Since end-July, MATIC traded sideways between a tight channel but an ascending triangle breakout proved to be the catalyst for a much needed bull run.
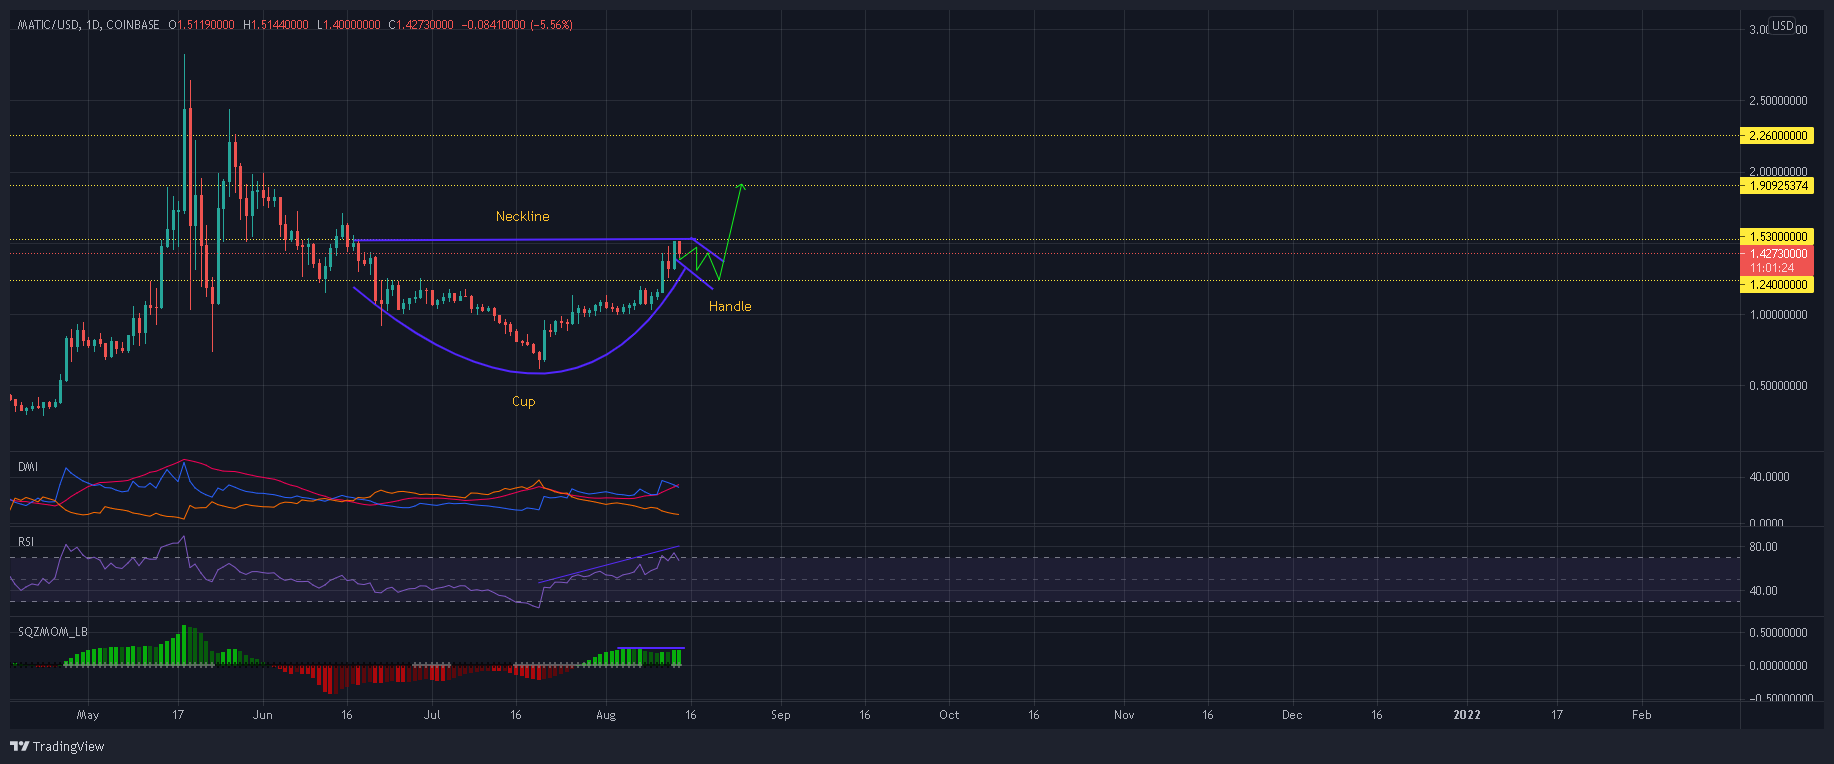
While a resistance point at $1.53 could temporarily halt the upwards trajectory, a retracement would actually complete a cup and handle pattern on MATIC’s daily chart. At the time of writing, MATIC traded at $1.426 and held the 16th spot in CoinMarketCap’s crypto rankings.
MATIC Daily Chart
Source: MATIC/USD, TradingView
Since mid-June, MATIC has formed lower peaks at $0.91, $0.60 and $1. A curved trendline was used to plot these points which formed the ‘cup pattern’ on the charts, while the upper trendline presented a resistance mark at $1.53. A handle would form in case of a retracement towards $1.24 support- a development that would complete the bullish setup for MATIC.
An upwards breakout from $1.53 resistance could then trigger a jump towards the next critical resistance mark of $1.90- representing gains of 24% from the aforementioned support. Conversely, an immediate hike above $1.53 would negate this setup.
Reasoning
Relative Strength Index flashed overbought market conditions and suggested that MATIC needed to stabilize before its next push forward. A double top was also spotted on the Squeeze Momentum Indicator which could result in a drop of buying pressure. Meanwhile, the Directional Movement Index’s +DI converged towards the -DI as some selling pressure seeped into the market. Such conditions threatened a short-term decline, although market control still belonged to the buyers.
Conclusion
Long term conditions were favorable in the MATIC market and even though a slight retracement was expected, this was well within the confines of a bullish cup and handle pattern. Traders wishing to long this pattern can initiate buy trades in case prices fall towards $1.24-support. A reversal from this defensive line could culminate into a 24% hike at MATIC’s upper ceiling of $1.90.


