This is how XRP traders can long this pattern

XRP investors have had a lot to cheer about lately. The alt has risen to a near 3- month high at $1.35 after rallying by 50% from $0.90. Its weekly ROI stands at over 24%, which is the second highest percentage gains among the top 10 coins by market cap. On the charts, buyers seemed to take a breather as prices moved south over the past few days, but another buy opportunity was on the table. At the time of writing, XRP traded at $1.11 with a market cap of $52.3 Billion.
XRP 4-hour Chart

Source: XRP/USD, TradingView
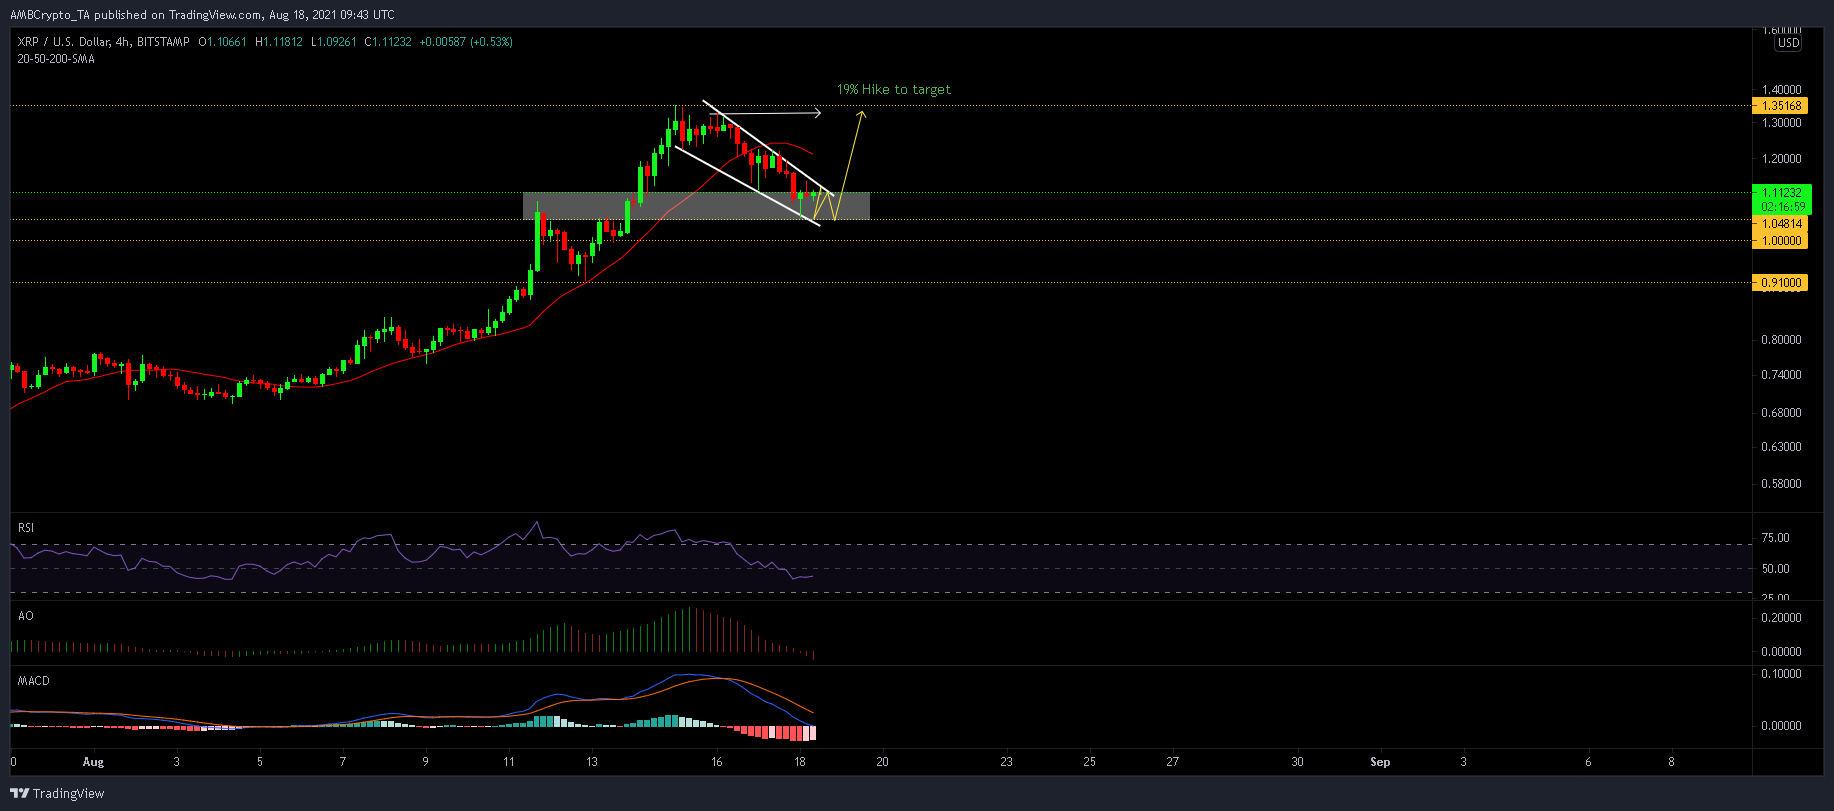
XRP’s descending wedge approached a critical support zone of $1.04-1.15, which was also backed the 50-SMA (yellow). Ideally, a breakout above the upper trendline would result in a hike towards the highest point of contact in the pattern at $1.33 (target)- which would signify gains of 19.5%. Keep in mind that the 20-SMA (red) still ran bearish and could limit an upside move even in case of a breakout. To negate this setup, sellers would first need to target a close below $1.05, from where additional drawdowns can be expected.
Reasoning
Before making any moves, bulls needed to negotiate through some red flags in the XRP market. The Awesome Oscillator fell below the half-line due to constant selling pressure- a development that usually functions as a sell-signal. Meanwhile, the RSI and MACD were slightly more measured. The RSI moved flat in bearish-neutral territory, while the MACD held above the half-line. Its histogram even noted some receding bearish momentum.
Conclusion
XRP’s descending wedge presented chances of an incoming hike but a few scenarios needed to play out before that. Losses needed to be contained within $1.04-$1.15, while the 20-SMA had to toppled to fully realize XRP’s potential. Meanwhile, traders could long XRP within the aforementioned support but must be cautious of a close below $1.04 as this would trigger an extended decline.


