This is the main difference between Litecoin and other Altcoins

Altcoins have started to move in the right direction as the market has built up on the recent bullish momentum. Litecoin has been one of the surprise inclusion which was facilitated growth from an on-chain perspective. While it may look great on paper, there are few more things that needs to incorporated and understood before estimating a Litecoin rally.
Active Addresses and Hodling Act?

According to Santiment, most altcoins were at a state of decline when it came to their daily on-chain statistics. However, Litecoin was following the other route, indicative of significant activity in the market. Data suggested that Litecoin’s 24-hour active addresses are currently witnessing all-time high levels for 2021. The rate of active addresses are higher than January-February 20201.

Similarly, addresses holding LTC between 1k-100k also raised their holdings by 270,000 LTC which is currently valued at ~$28.5 million. It is a massive accumulation of data which is suggestive that LTC holders are holding out for a bullish promise with the altcoin.
However, it is important to understand that the Litecoin market may not react proactively to these bullish signs.
Litecoin ASOL-MSOL state
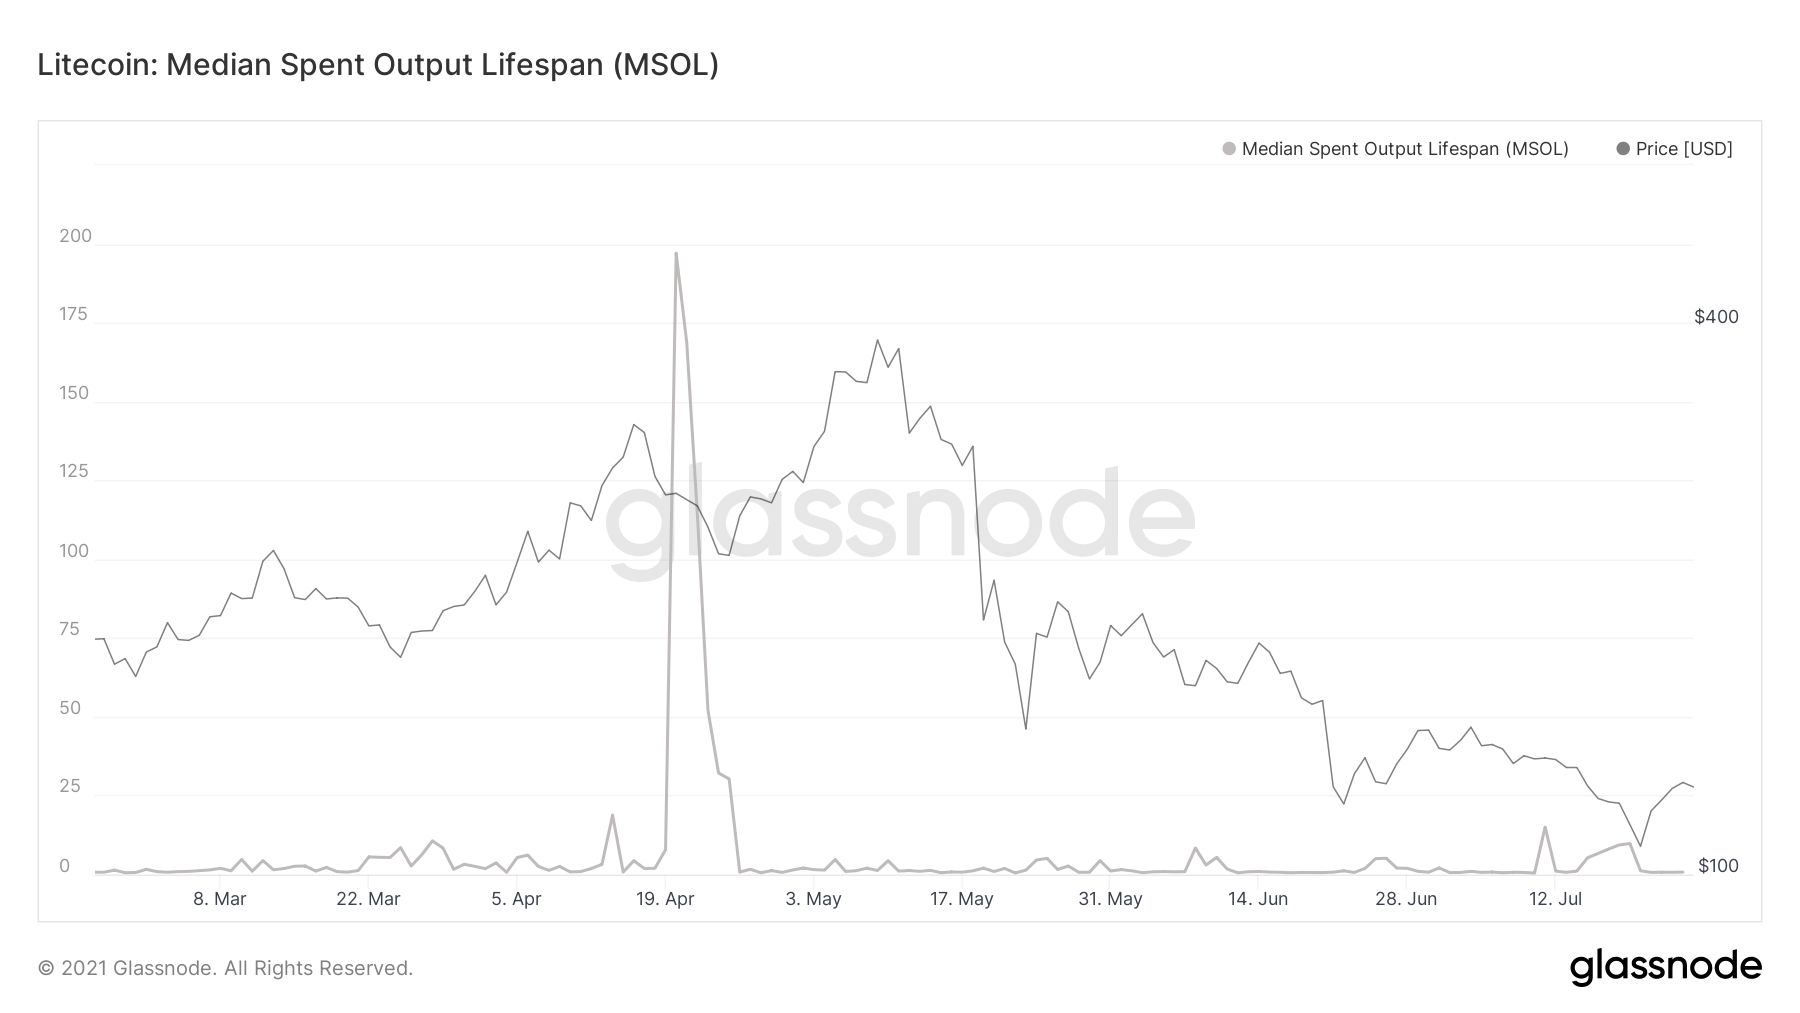
Litecoin’s MSOL or Median Spent Output Lifespan indicates how the asset’s movement might have reacted during the past few weeks. Bitcoin’s MSOL chart reflected strong movement during the past few days but for Litecoin, it has been radically quiet. Now, MSOL is based on the movement of old and new coins in the industry, and a tepid MSOL meant that only new coins are currently responsible for the traffic.
Now a couple of inferences can be drawn based on the MSOL. Either the asset is surging due to simple re-balancing, where the buying pressure is driving the asset towards pre-set liquidity pools, or LTC hodlers never buckled in the first place. Hodlers keeping a strong position in the industry is positive, but it is nothing new for the LTC community.
Weekly Chart Work?
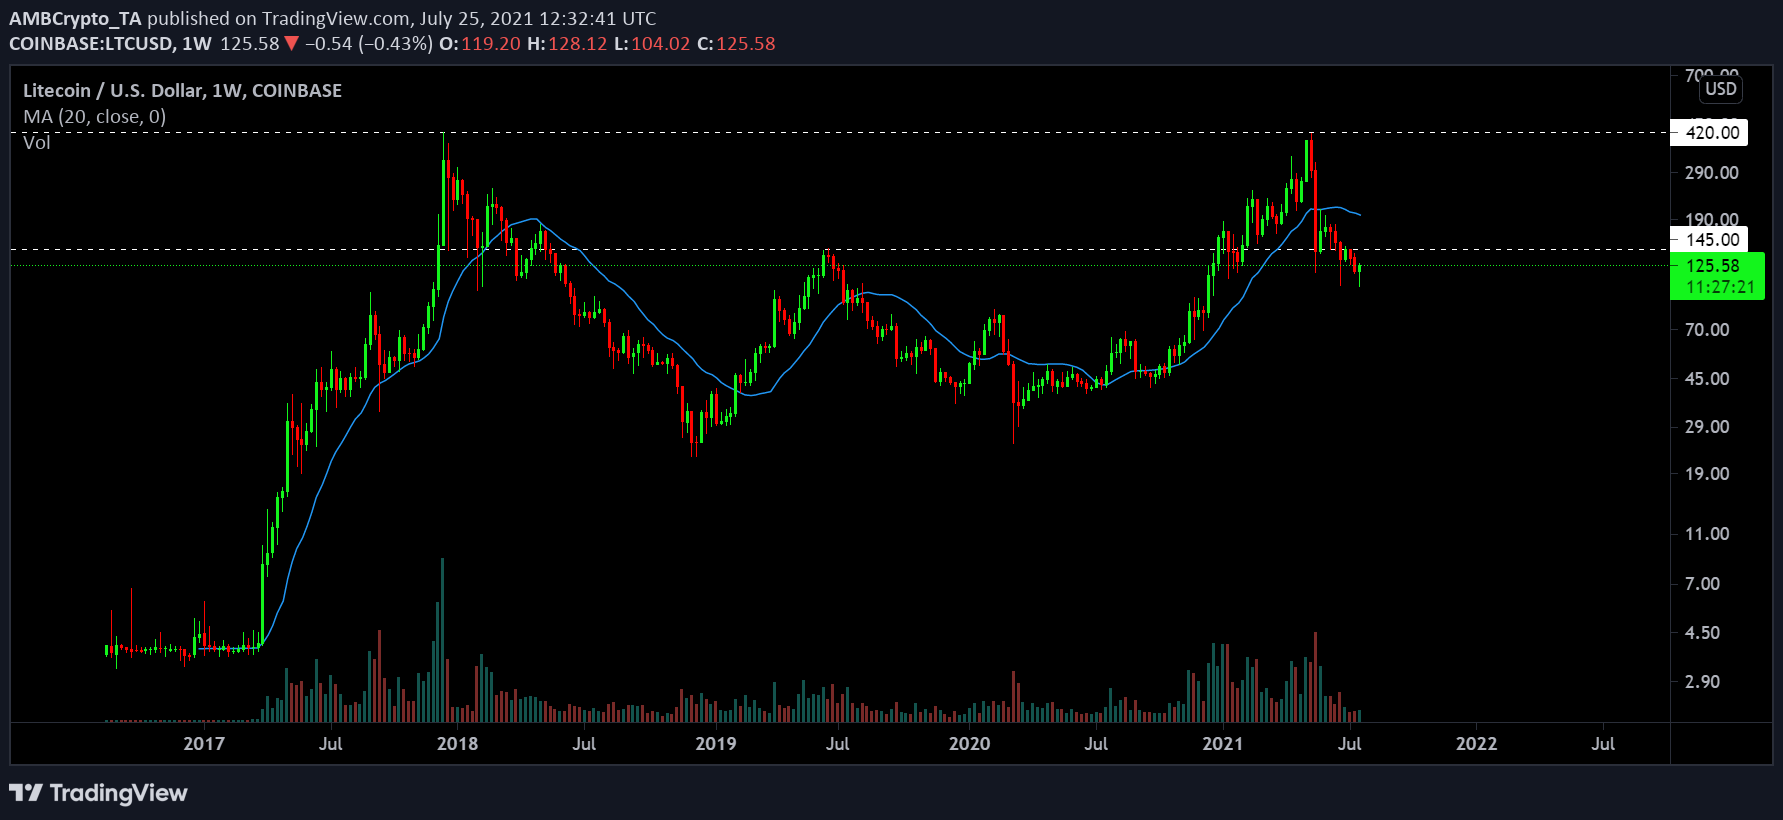
While assets such as Bitcoin, Ethereum, Binance Coin, Cardano, etc reached new ATHs during the 2021 rally, Litecoin hardly closed a weekly candle above its 2017 high. Observing the weekly chart also presented the reduction of trading volumes over the course of both cycles.
Litecoin wasn’t able to consolidate above its immediate support of $145 as well, which was the 2019 high. The valuation remains firmly under the 20-Moving Average but the main concern remains its sideways movement on the weekly chart.
In comparison, every other asset mentioned above has witnessed a steady rise in the chart.
Litecoin: same old story?
Improving on-chain metrics is always a positive but pinning hopes on it for a considerable recovery is a step too far. With Litecoin, there hasn’t been anything drastic from an individualistic sense of growth, so only time will tell if that changes.


