This supply zone is quickly becoming a bottleneck for AAVE

One of the largest lending protocols in the market, the Aave protocol had $9.9 billion in TVL and its native coin had a market capitalization of $2 billion. On the charts, the token has been on a downtrend since mid-September. In early February, the coin gained some bullish momentum and demand which appeared likely to push to coin to the $205 resistance level.
However, sellers were quite strong at the $190 level. In the next few weeks, a move toward $200 could materialize, and would likely be a selling opportunity.
AAVE- 12H

The trendline resistance (blue) has seen AAVE form a series of lower highs (the insane candlewick to $460 in October being disregarded as a possible fat finger event). At the time of writing, the longer-term market structure remained bearish. The lows set in early January (dashed green) were retested as resistance recently. The $205 horizontal resistance was not even tested on the recent rally.
This indicated that the market, on the longer timeframes, was more ready to sell than to buy. Therefore, the $205 area and the trendline resistance offer places where AAVE can be sold, if it reached there. Hence, $190, $205, and $240 were levels where bears can be expected to have heavy sell orders at.
Rationale
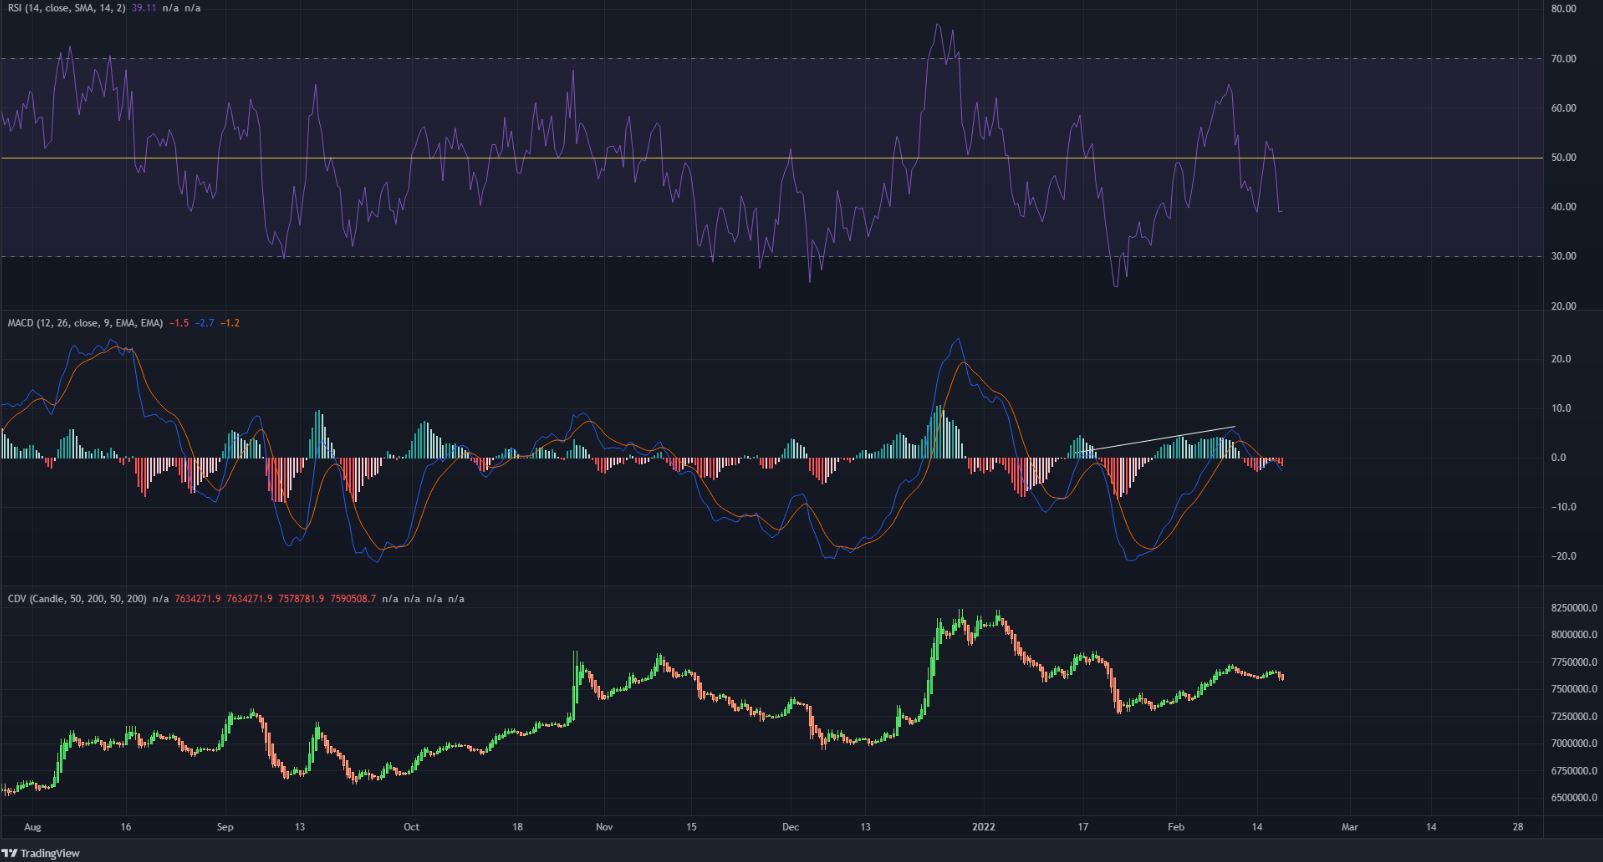
On the 12-hour chart, the RSI tried and failed to climb above the neutral 50 mark in recent days. It showed a value of 39 at the time of writing, to highlight the recent downward momentum.
The MACD formed a higher high in the past month, even though the price formed a lower high in the same time period, from $242 to $190. The indicator was also unable to climb convincingly past the zero line.
The CDV showed that buying volume has generally outweighed the selling volume in recent months, yet, the trend of the price has been downward.
Conclusion
The momentum divergence showed that AAVE could be forced to drop to $140 or lower, while the trendline resistance also appeared to be insurmountable at the time of writing. In recent months, buying volume has been greater than the selling volume, but unless the market structure flips to bullish, this evidence might not be actionable from a trader’s perspective.
Disclaimer: The findings of the following analysis are the sole opinions of the writer and should not be considered investment advice