This would provide confirmation of this incoming price move for Polkadot

The global cryptocurrency market has not fared too well in July so far. The month started off with a bullish week but prices began to gradually decline due to a lack of sustained buying pressure. While some alts have been able to cope up with rising selling pressure, the same cannot be said for Polkadot.
The digital asset saw a 25% drop in value over the last 10 days alone, but losses were kept in check at a defensive line of $11.6. At the time of writing, DOT held the 9th spot in the crypto rankings with a market cap of $12.4 Billion.
Polkadot 12-hour chart
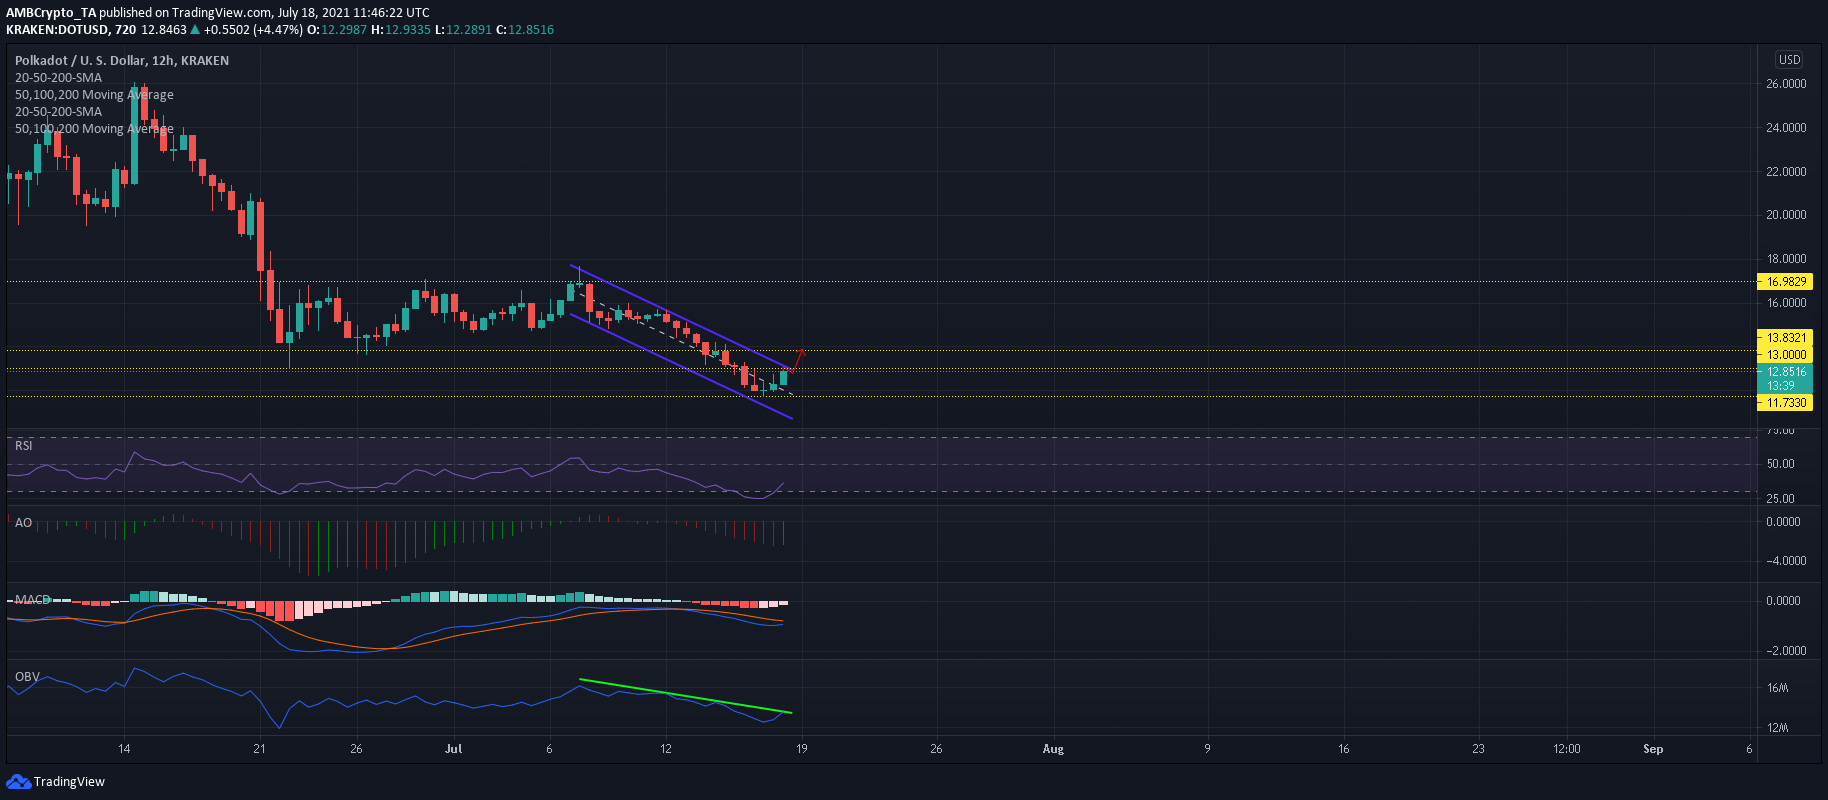
There were not many bullish takeaways from DOT’s chart. While prices maintained a horizontal channel and traded mostly between $14-17 since end-June, a breakdown resulted in a steady 16% fall towards a support mark of $11.7. In fact, its fall at the aforementioned level represented a 6-month low for the digital asset.
On the plus side, the formation of a Doji candlestick indicated an upcoming reversal that saw DOT register some bullish movement over the past couple of days. Focus now shifted on the upper trendline of DOT’s down-channel- a region that coincided with 22nd June’s swing low of $13. A successful close above this point would likely push DOT back towards $13.8-14 which had now flipped to resistance. Such a move would highlight gains of an additional 9% from the press time level.
Reasoning
Relative Strength Index showed oversold conditions in the market which triggered a reversal in prices. A sustained rise towards the half-line would indicate rising buying pressure and a strengthening trend. The On Balance Volume also saw a slight uptick and confirmed with DOT’s price action. A move above the upper trendline would increase the chances of a sustained rise in the coming days. Finally, the MACD approached a bullish crossover, while its histogram noted receding bearish momentum.
Conclusion
DOT’s bullish resurgence at $11.7 support fueled optimism in the market and lent support to an extended rise over the coming days. A rise above 22nd June’s swing low of $13 would provide confirmation of a favorable outcome and once it occurs, traders can opt to long DOT in order to capitalize on the projected hike.


