THORChain: Assessing the chances of RUNE reaching the $10 mark

Disclaimer: The findings of the following analysis are the sole opinions of the writer and should not be considered investment advice.
A pattern with Bitcoin’s price action and the FOMC meetings suggested that Bitcoin could see a bounce toward $45k over the next month. RUNE saw a strong bounce and a shift in market structure toward the bullish side. A bearish divergence could see a minor drop toward $6.5 for the token, after which a run toward $9 and $10 could resume.
RUNE- 1 Day Chart
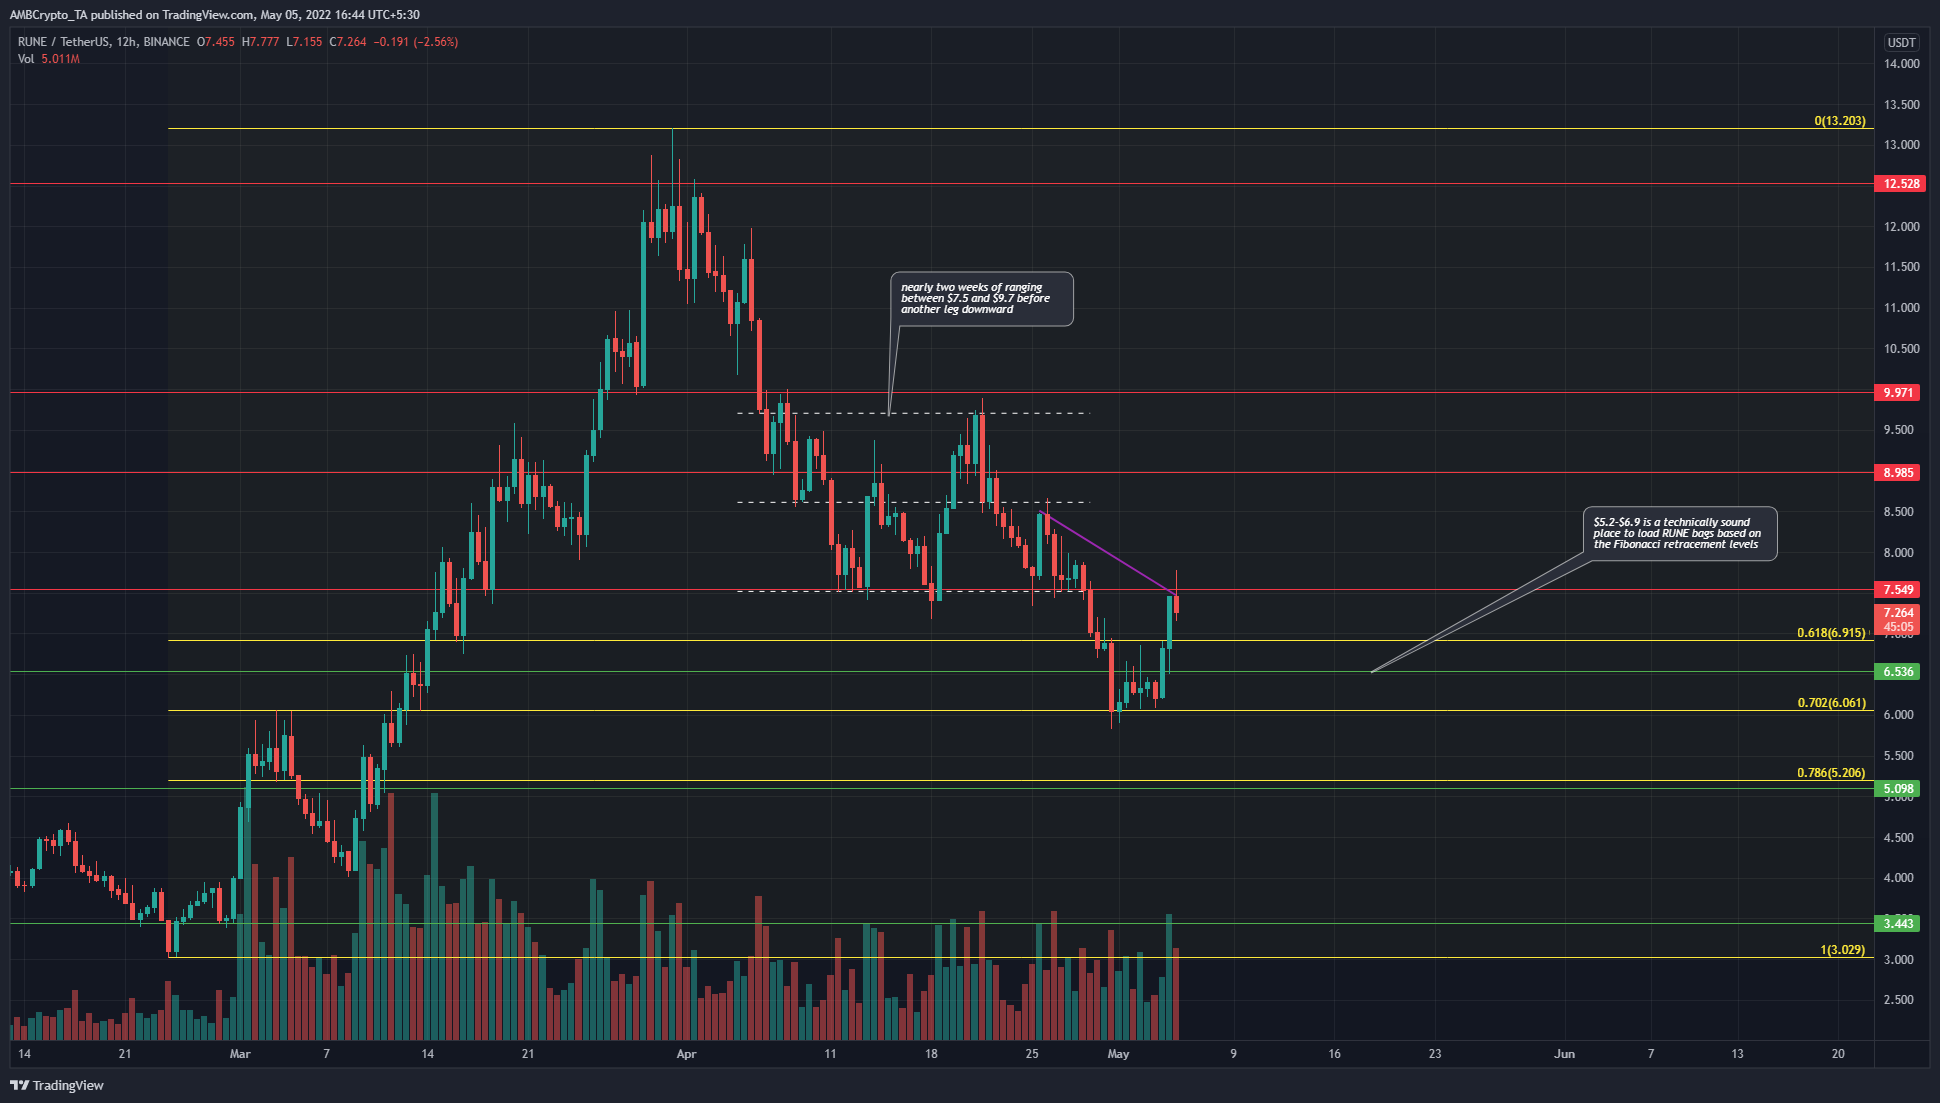
When RUNE dropped below $10 in early April, the market structure flipped to bearish as the recent higher low at $10 was broken. On the way down, the price set the most recent lower high at $7.18 in late April, and in the past couple of days, RUNE was able to breakout past this level.
Moreover, based on the Fibonacci retracement levels (yellow), it appeared that the $6 level had held reasonably well in the face of a bearish onslaught. The entire region from $5.2 to $6.9 can be used to dollar-cost average into a long position on the Thorchain native token.
Rationale
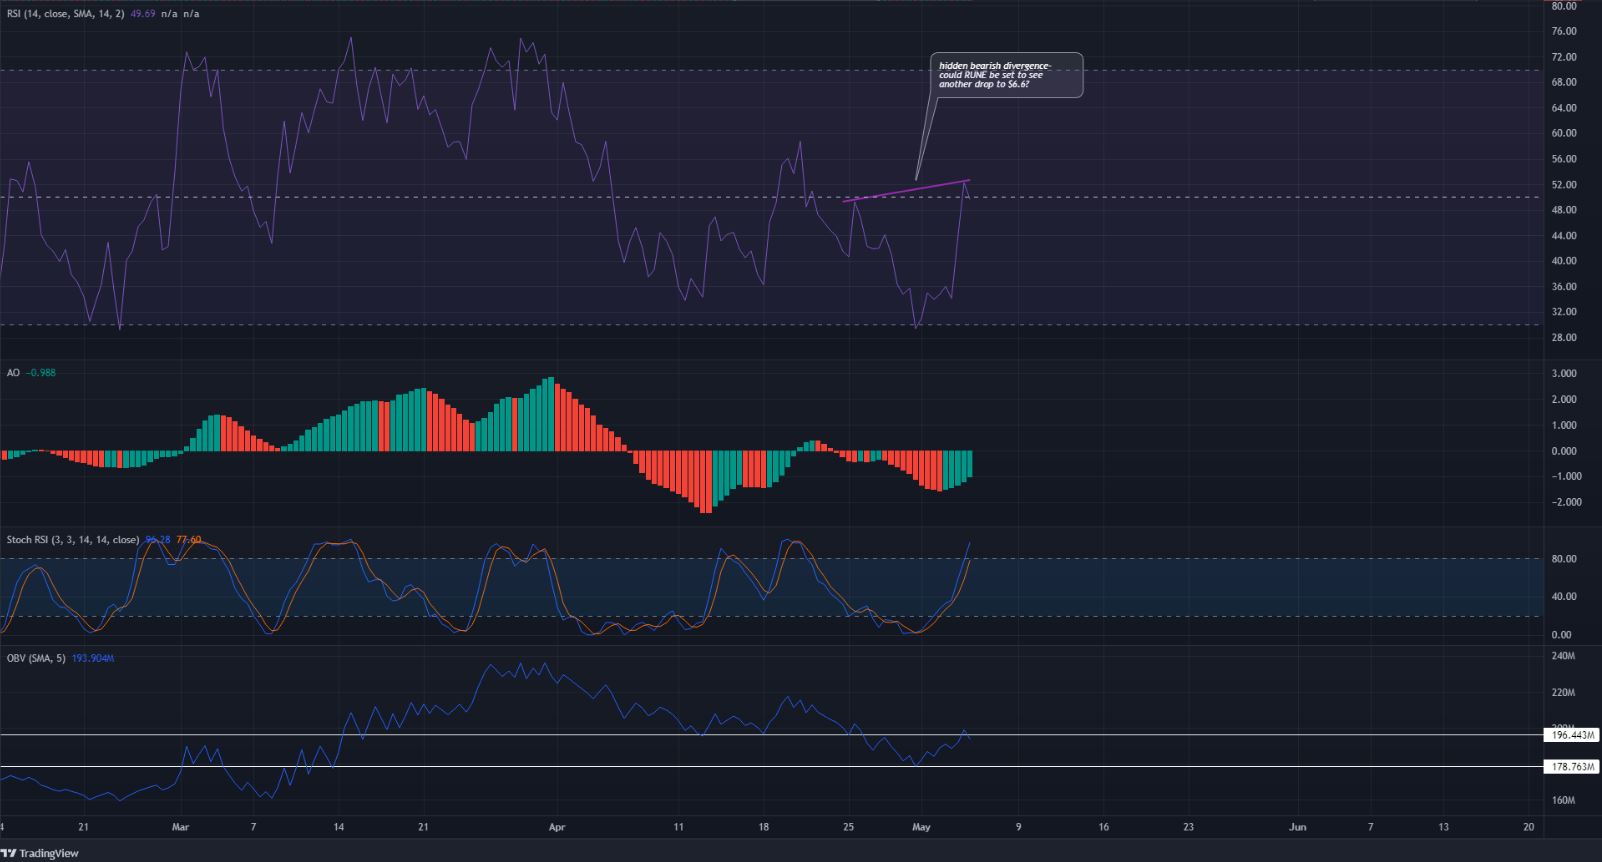
The indicators showed that another leg down could be seen. The RSI showed a hidden bearish divergence (pink) between the price and momentum. This meant the previous bearish trend could continue.
Yet, the price has broken past the most recent lower high of the downtrend at $7.18. Hence, it was more likely that a drop toward $6.5-$7 could occur rather than the resumption of the previous downtrend.
The Awesome Oscillator continued to remain below the zero line, similar to how the RSI was unable to rise past neutral 50. The Stochastic RSI was also headed toward the oversold territory. On the OBV, a level of support last month has acted as resistance, and it would need to climb past the resistance once again to show bulls to be in the driving seat.
Conclusion
Even though the market structure appeared to have shifted in favor of the bulls, the momentum indicators showed that a drop toward $6.5 could be seen. Such a dip could be a good buying opportunity, with take-profit targets at $8.5 and $9.7-$10.


