To HODL or not, what do Stellar’s charts really say

Disclaimer: The findings of the following analysis are the sole opinions of the writer and should not be considered investment advice
After testing its 20-month trendline support multiple times, the bears finally breached it in December last year. Since then, Stellar (XLM) has been on a swift decline between its southbound parallel channels (white).
Now, a dependable close above the $0.178-mark is critical to confirm a bullish divergence with its OBV. This could brighten the chances of a 20 EMA (red) retest. Following this, if the buyers continue their pressure, a patterned breakout could be lurking around the corner.
At press time, XLM was trading at $0.1788, down by 2.74% in the last 24 hours.
XLM Daily Chart
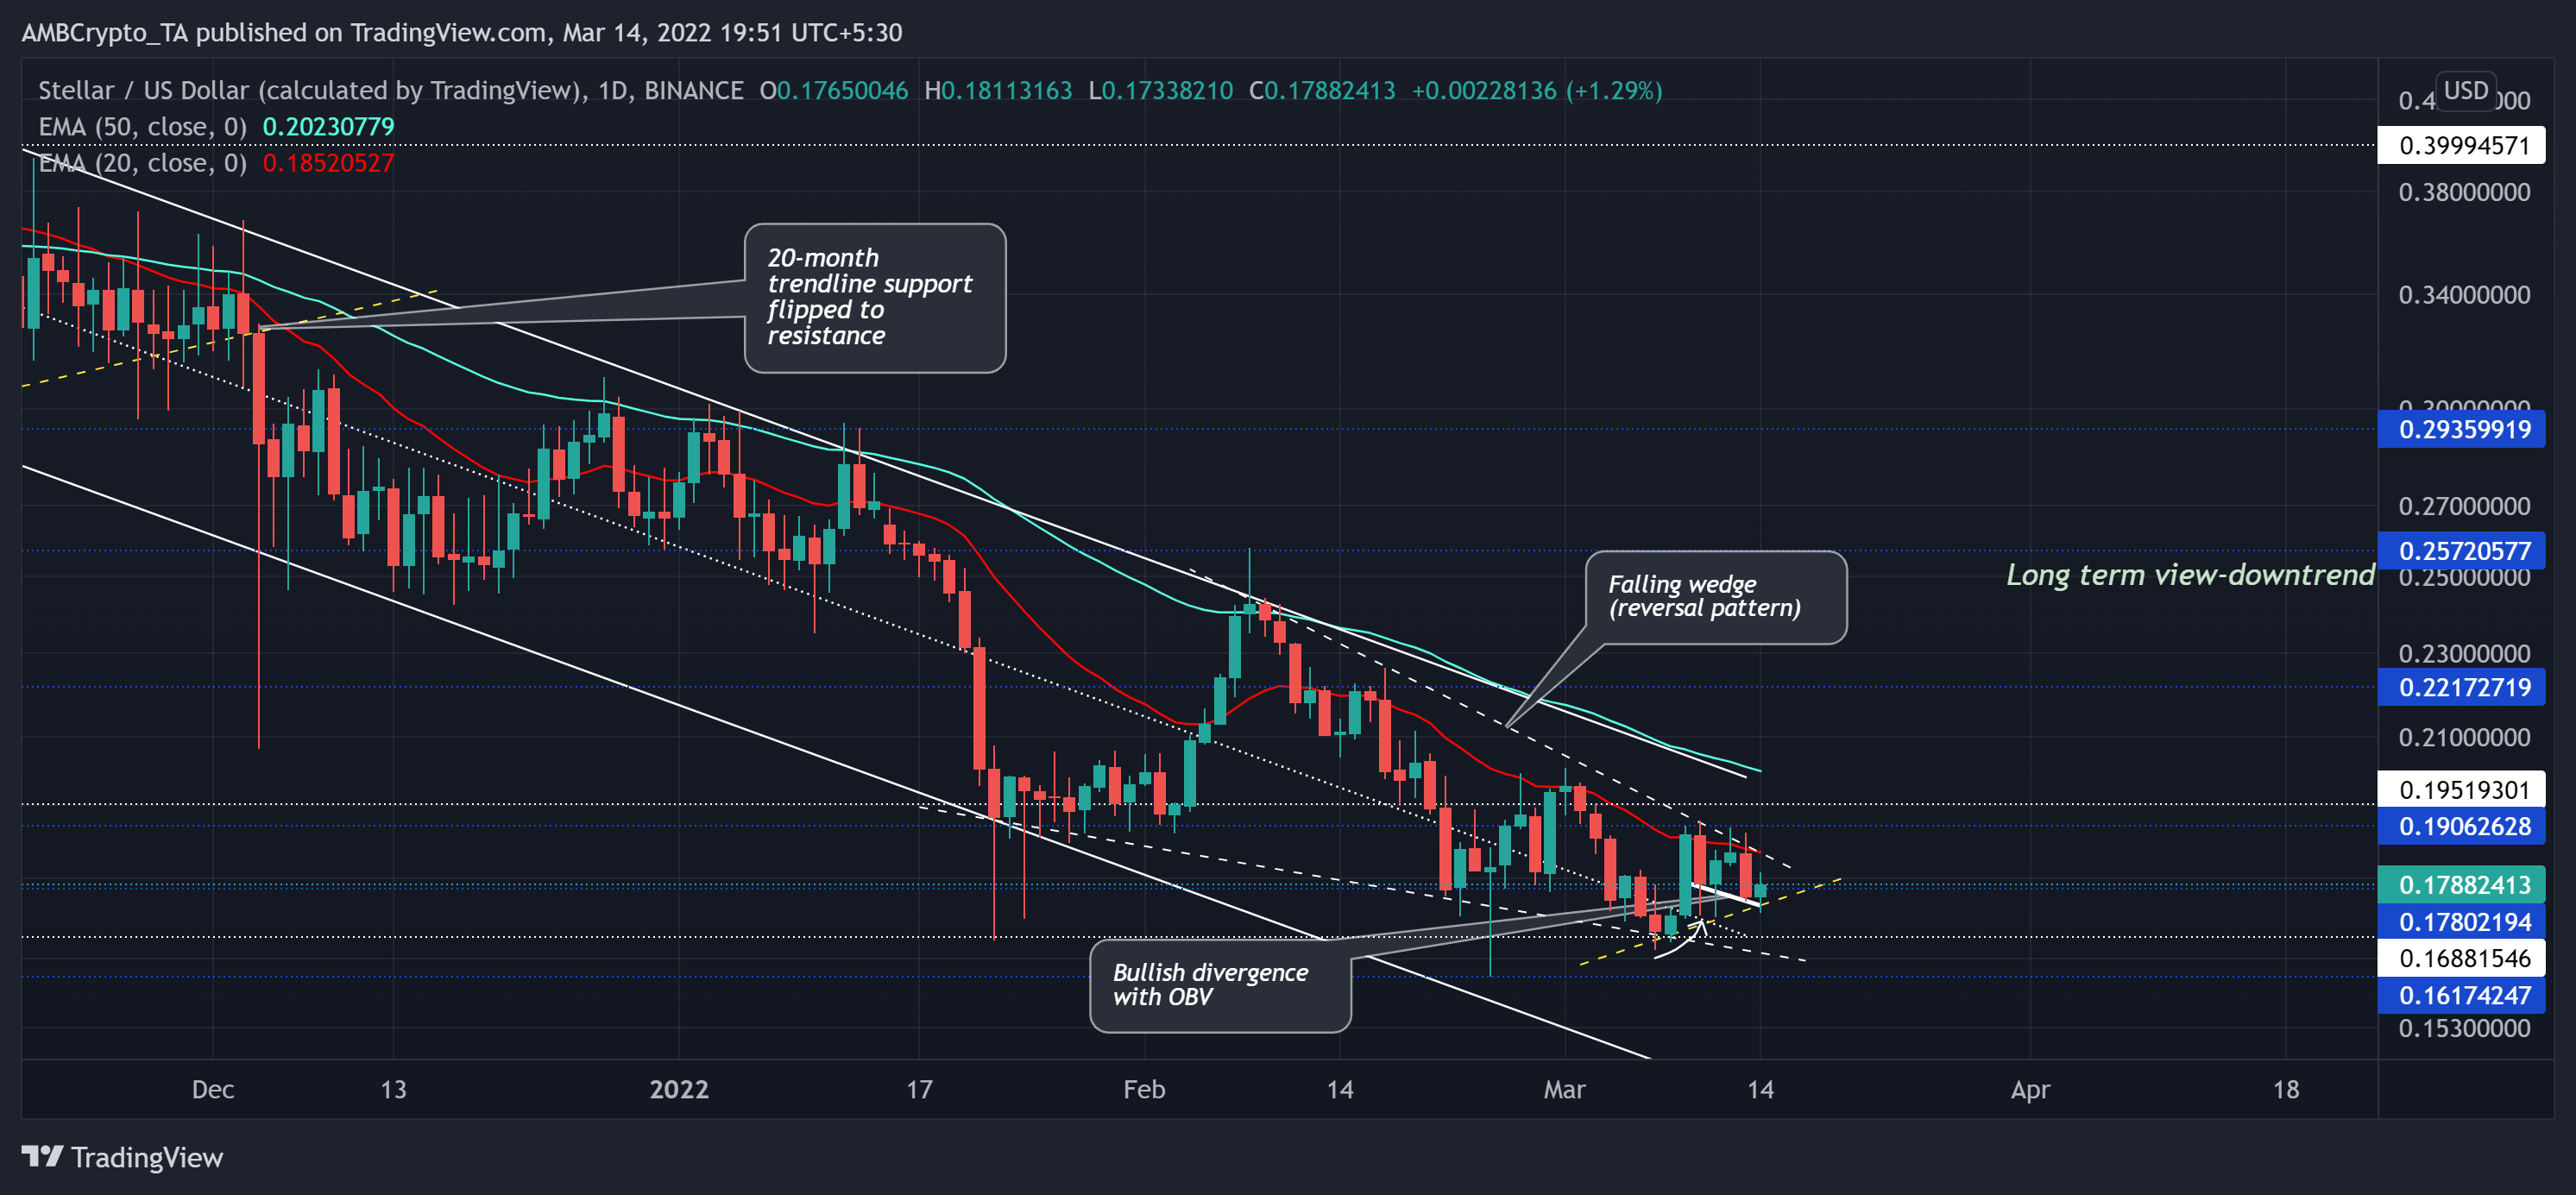
After XLM struck the $0.8-level, it turned south and traded between the $0.19-$0.39 range for over eight months. Following this, the bears flipped the vital $0.19-mark to resistance from support.
The recent bearish phase marked a down-channel (white) on its daily chart as the alt lost nearly 63.4% (from 10 November) and hit its 13-month low on 24 February. During this phase, the 50 EMA (cyan) posed as a strong barrier for the bulls. They strove to find a sustainable close above this level for nearly four months. Meanwhile, XLM fell after marking a falling wedge on its daily chart.
Going forward, if the 14 march candlestick closes above the $0.178-mark, it could open up recovery chances towards the $0.18-range. Post the same, a pullback towards its trendline support (yellow) would be conceivable before a patterned breakout attempt.
Rationale
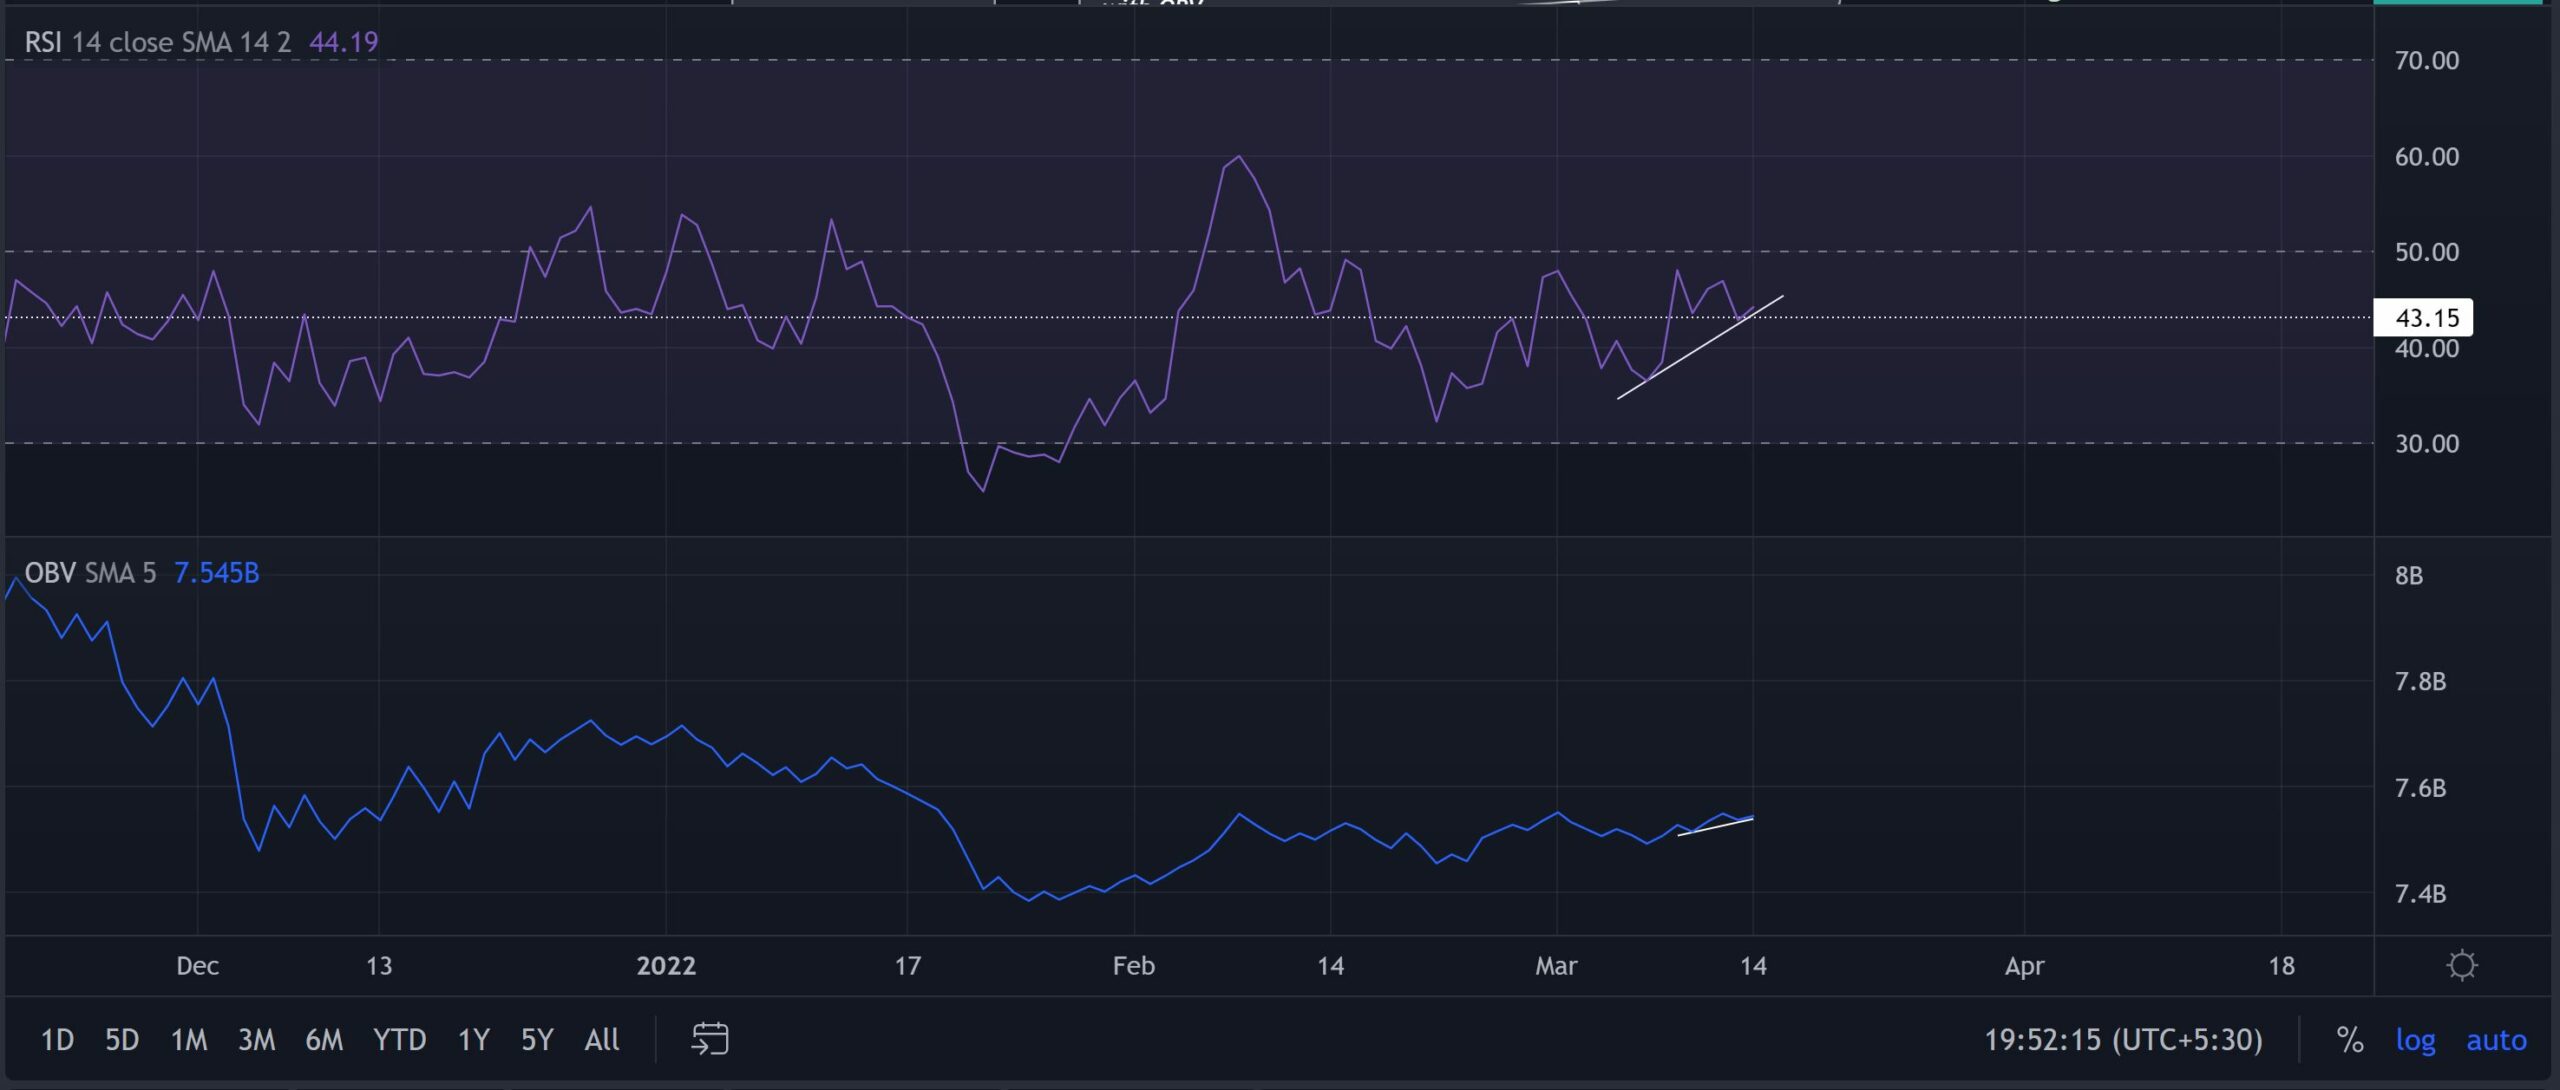
For the past month, the RSI has struggled to find a close above its midline, thus affirming the bearish edge. Alas, as the bulls ensure the 43-mark support, a further test of its midline could be probable.
Interestingly, the OBV saw higher troughs in the last four days while the price took a plunge. This hinted at a bullish divergence if the press time candlestick closes as green.
Conclusion
Keeping in mind a potential bullish divergence with the OBV, XLM could see a near-term revival. Following this, it could retest its trendline support before being in a position to challenge its current pattern.
Besides, the investors/traders should factor in the broader market sentiment and the on-chain developments to make a profitable move.