Tracing Ethereum’s [ETH] potential to continue rising after its recent gains
Ethereum's recent gains led to overbought readings on its Bollinger Bands and RSI. The resulting decline could slow down the buying spree. The bulls could look for potential rebounding opportunities for placing long bets in the coming sessions.
![Tracing Ethereum's [ETH] potential to continue rising after its recent gains](https://ambcrypto.com/wp-content/uploads/2022/10/Untitled-design-40.png)
Disclaimer: The findings of the following analysis are the sole opinions of the writer and should not be considered investment advice.
- Ethereum’s recent reversal from its resistance highlighted ease in buying pressure.
- The altcoin noted a substantial decrease in its daily active users over the last day.
Ethereum [ETH] witnessed double-digit gains over the last week after breaking out of its triangular structure. The resultant incline above the basis line (green) of the Bollinger Bands (BB) positioned the altcoin near its upper band to depict a buying edge.
Here’s AMBCrypto’s price prediction for Ethereum [ETH] for 2023-24
Should the recent reversal from its immediate ceiling continue, ETH could see a near-term pulldown before a likely reversal. At press time, ETH was trading at $1,499.46, down by 3.1% in the last 24 hours.
ETH saw a bullish volatile break, can the buyers sustain their edge?
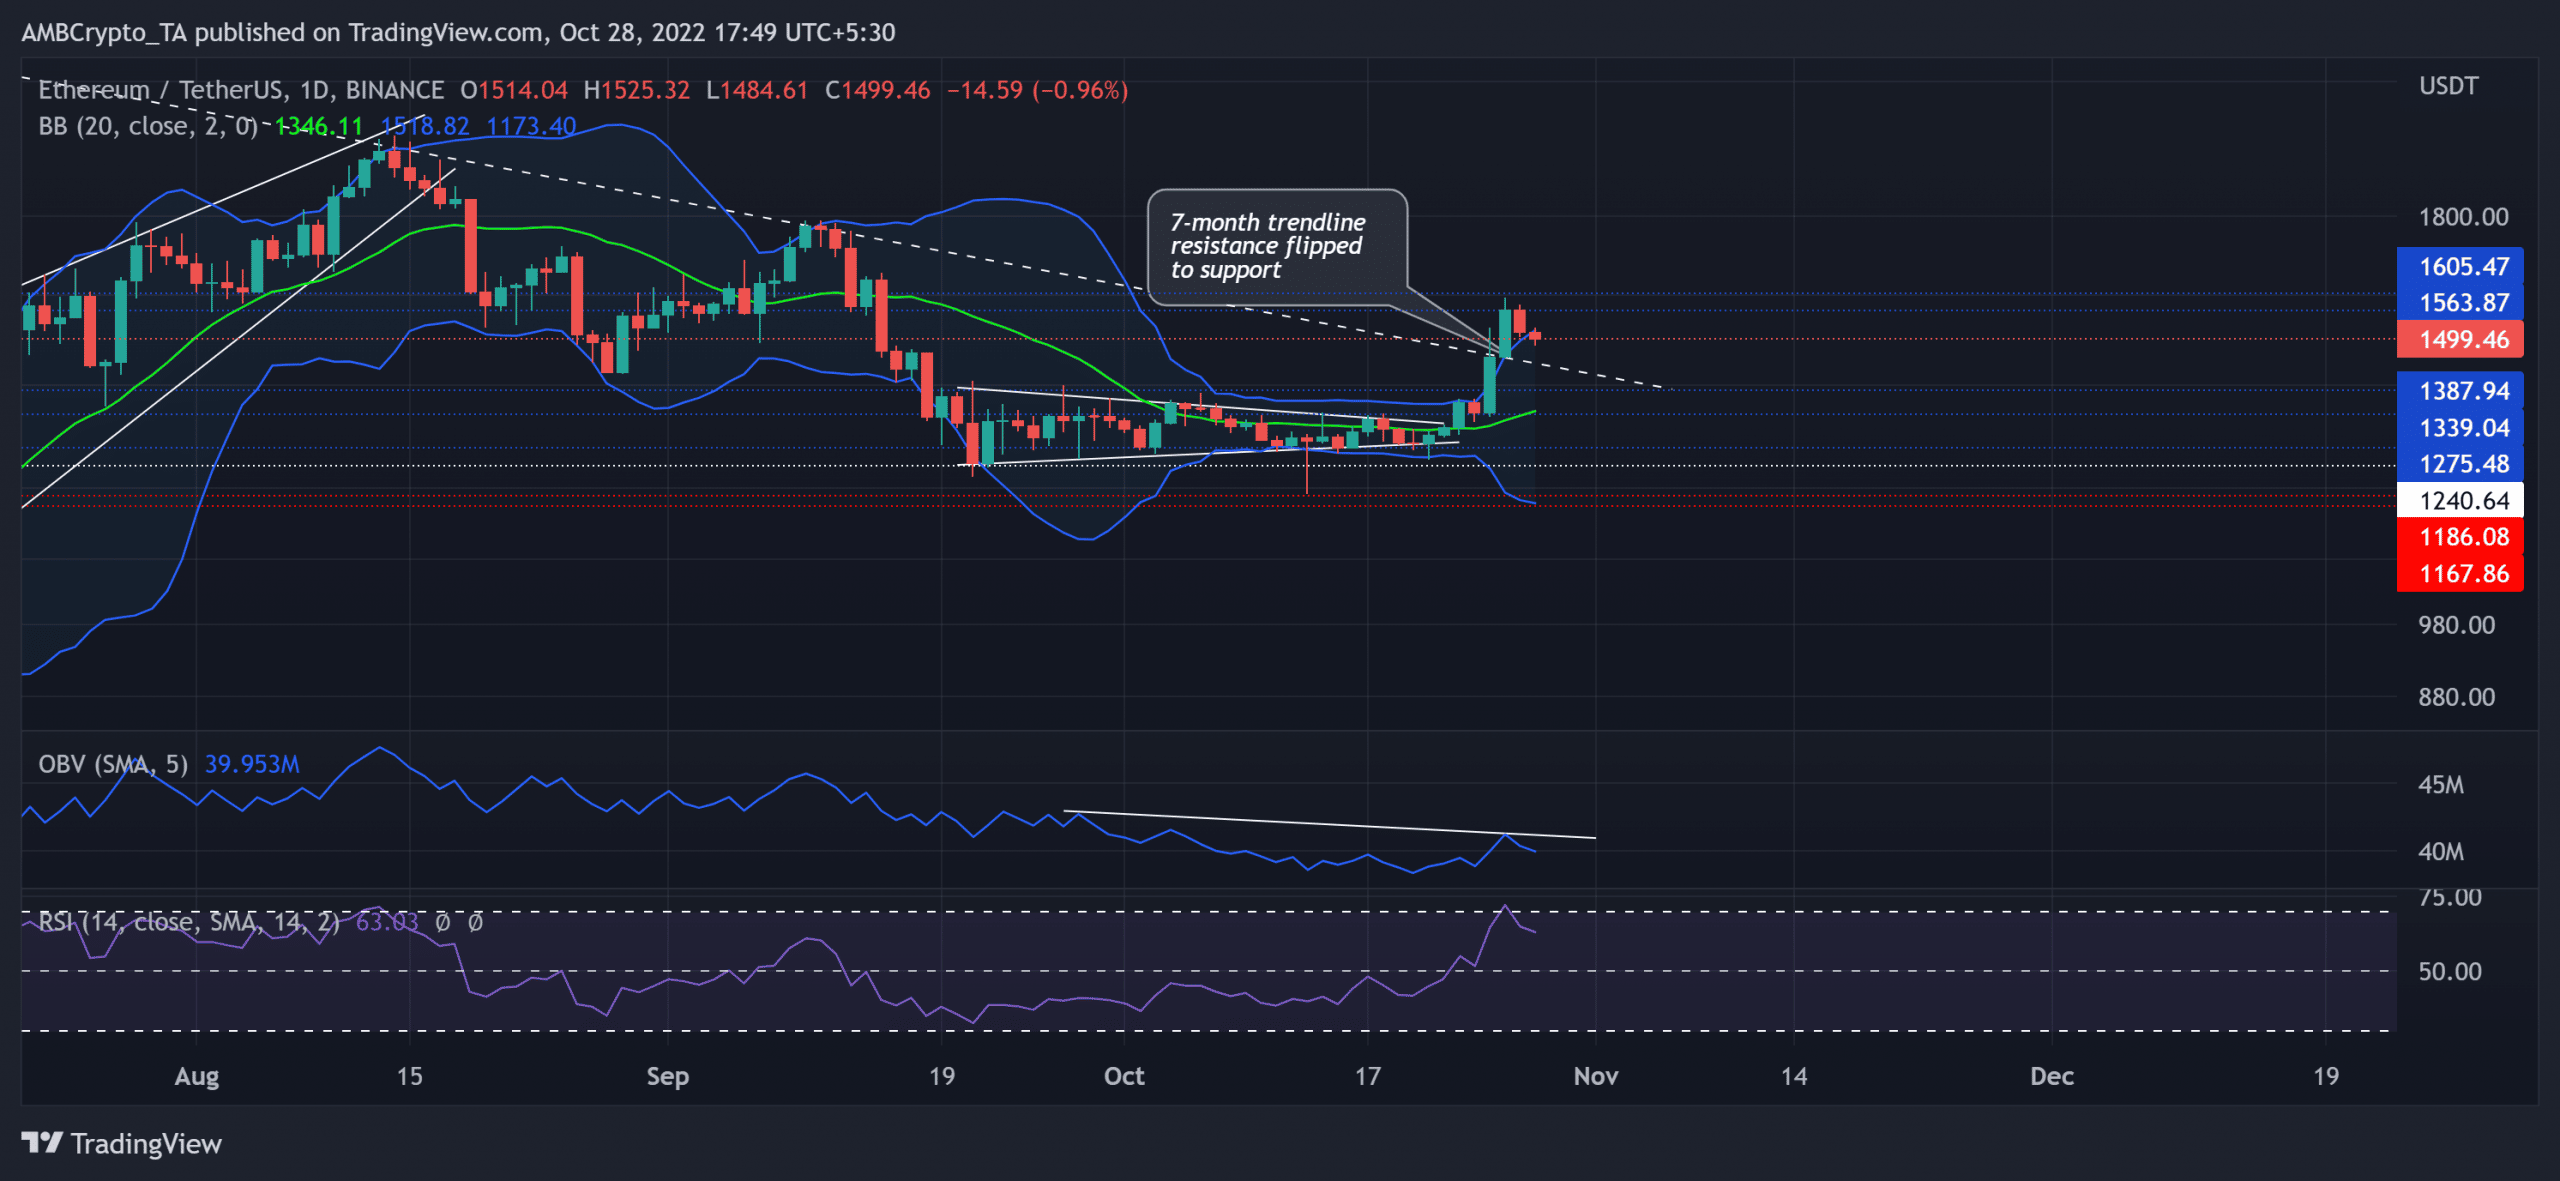
After breaking down from its rising wedge in the daily timeframe, ETH bears consistently exhibited their willingness to counter the buying efforts at the seven-month trendline resistance (white, dashed).
As a result, ETH looked south while struggling to sway above the $1,560-$1,600 range. The recent price movements chalked out a symmetrical triangle breakout after a steep uptrend. While the resistance range stood sturdy, the king alt could see a string of red candles.
This decline could open gateways for a retest of the $1,440 level in the coming times. Any decline below this level could propel the sellers to pull ETH toward the $1,380 support. The buyers could then strive to look for a near-term rebound.
On the other hand, an immediate rebound above the upper band of the BB would affirm a bearish invalidation. For this, the buyers must break the bounds of the $1,600 ceiling.
The On Balance Volume (OBV) depicted a bearish edge after its lower peaks bearishly diverged with the price action. Furthermore, the Relative Strength Index (RSI) reversed from its overbought region to depict ease in buying pressure.
A decline in exchange inflows alongside the daily active addresses
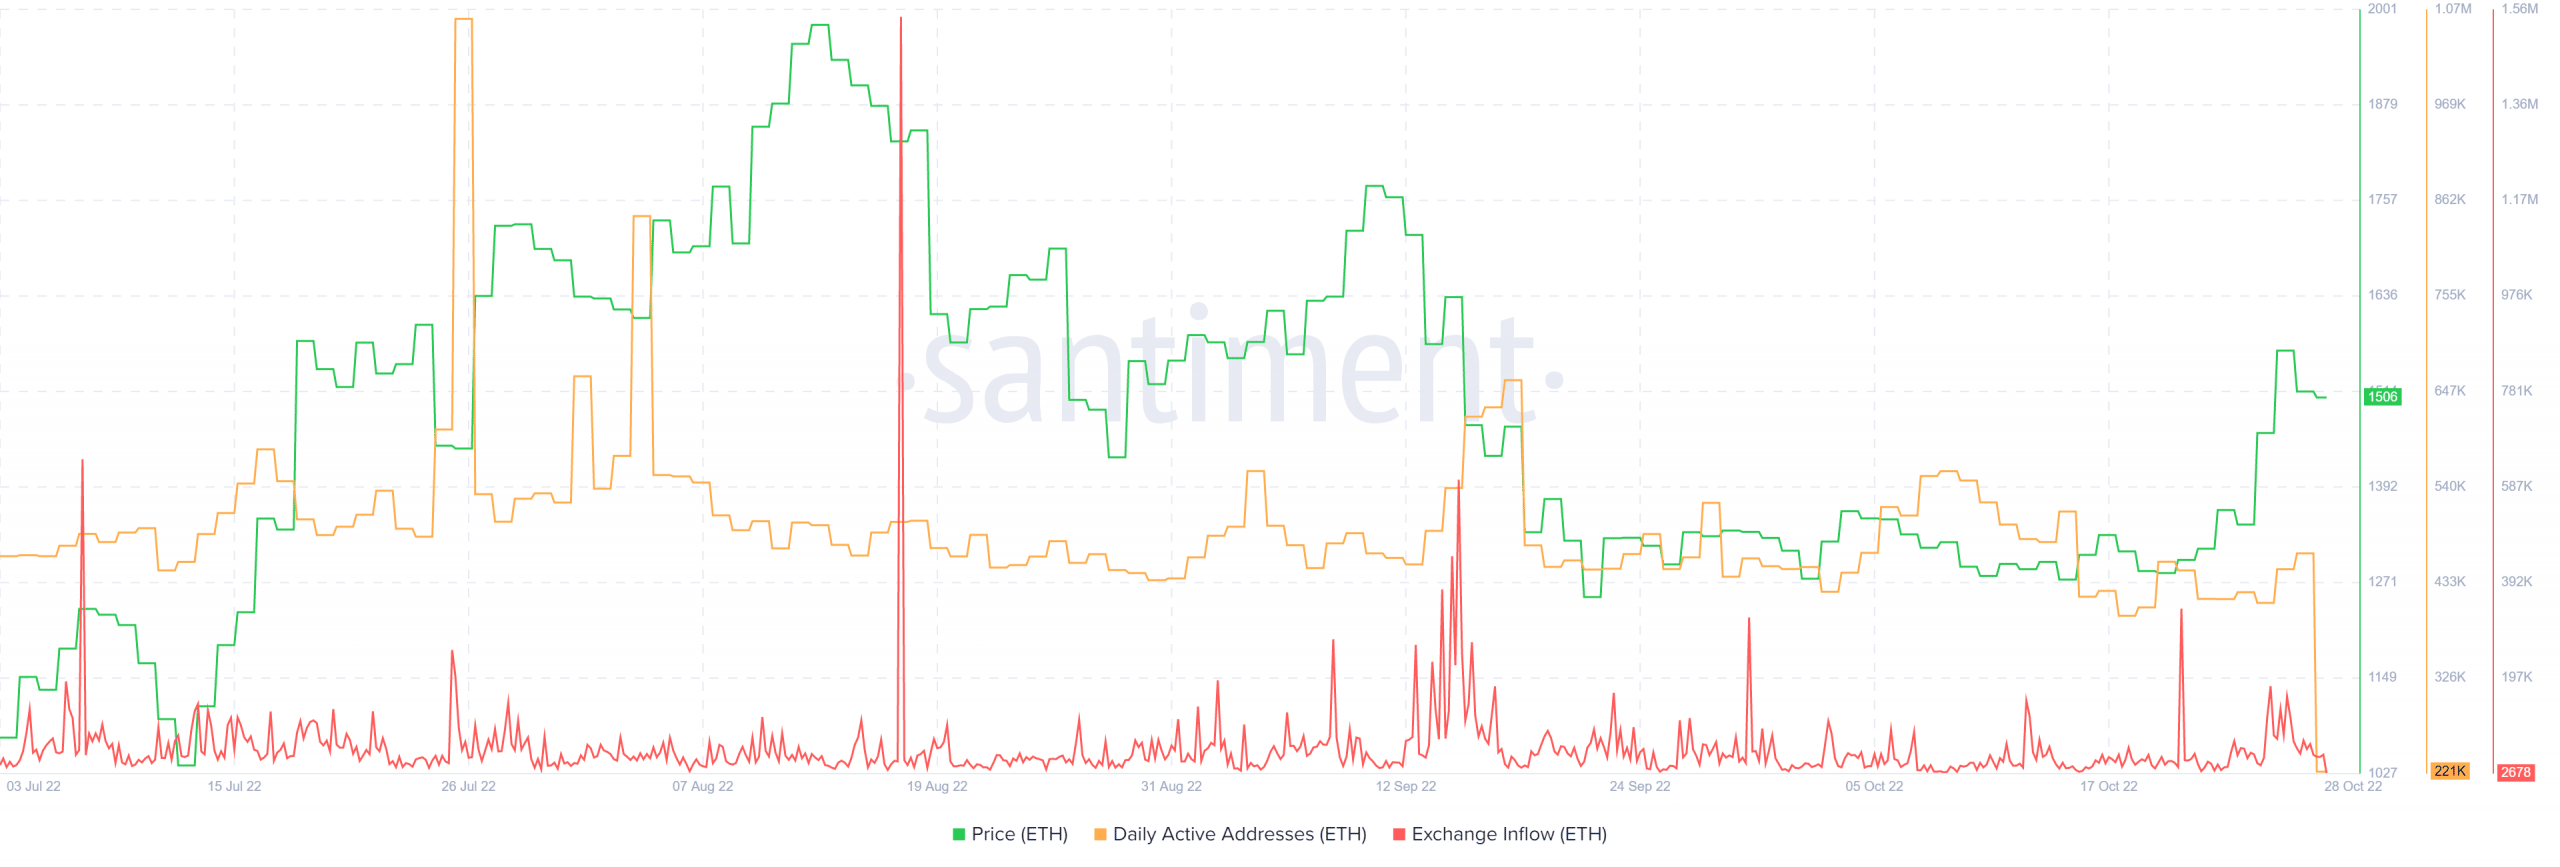
The king altcoin’s daily active addresses marked a substantial plunge in the last 24 hours. The last time the active address count fell to such lows was in October 2020.
Additionally, the price action generally tends to mark a decline after a spike in exchange inflows. But after the recent spike on this metric, ETH saw a rather increase in its price over the last few days.
Should these readings represent an underlying selling edge, the price action could see an extended decline before reversing. Finally, investors/traders must watch out for Bitcoin’s [BTC] movement. This is because ETH shared an 89% 30-day correlation with the king coin.


