Dogecoin bulls have to managed to sustain its price after a 27% surge on 5 August. The much needed rally came after DOGE largely traded sideways since end-July. So what does this mean for the popular meme coin? Is another price hike on the table? At the time of writing, the alt traded at $0.267 and held the seventh position in CoinMarketCap’s crypto rankings.
Dogecoin Daily Chart
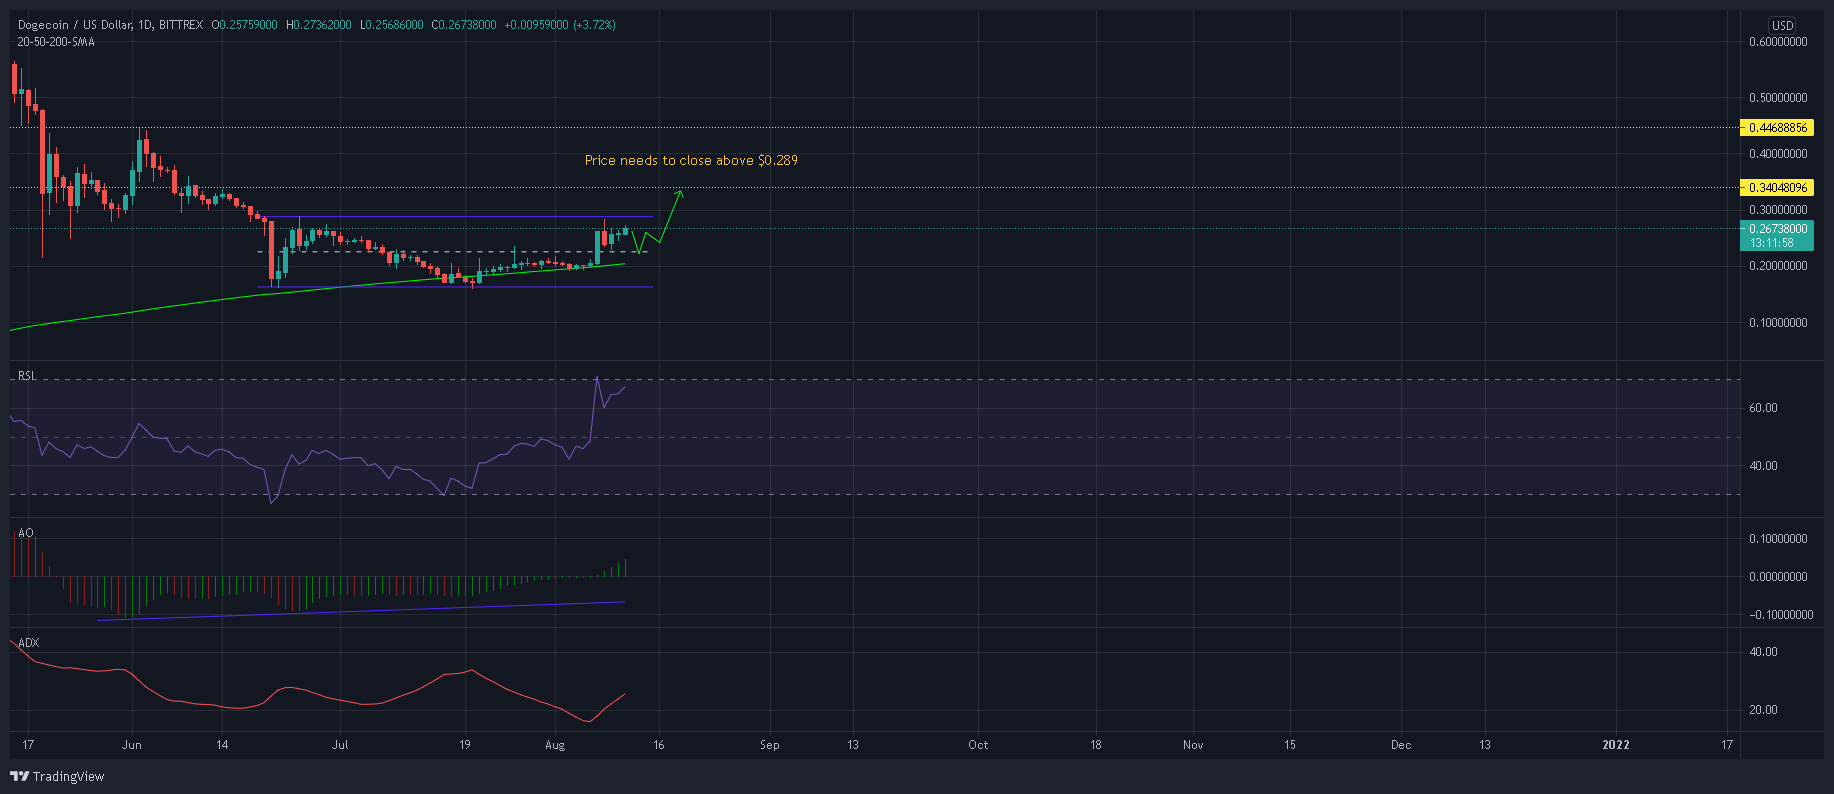
Source: DOGE/USD, TradingView
The key to Dogecoin’s movement seemed to be closely tied to its 200-SMA (green). The long term moving average line has offered support to DOGE over the past few weeks and, at times, has even prevented an extended market decline. On the 4-hour chart, this situation was slightly different.
The 200-SMA had run bearish since 19 May and rejected multiple breakout attempts over the past few months. This trend finally changed last week when DOGE broke above its 17th June swing high of $0.205 and registered a 3-week high of $0.283. However, prices were still within the confines of a horizontal channel on the daily chart and awaited a key move over the coming days for another rally. A close above 25th June swing high of $0.289 could likely be the catalyst for a such a move- in which case another 19% surge was possible towards $0.340.
Reasoning
Last week, RSI climbed above 55 for the first time in nearly two months. The index even maintained its trajectory and targeted a second peak in the overbought zone. A move above 70 would heighten chances of further upside before sellers enter the market.
The Awesome Oscillator also noted a clear rise in buying momentum over the past few days. Moreover, the ADX also rose above 25 which indicated a strengthening market trend. While these factors were certainly favorable for another DOGE hike, the lower timeframe (4-hour) highlighted several bearish divergences. What this meant was that DOGE traders might have to remain calm before its next leg upwards. In fact, a minor retracement was also on the table before the anticipated upswing.
Conclusion
DOGE needed to close above $0.289 on its daily chart for its next big move. Before such an outcome, prices could retrace slightly since the lower timeframe noted some bearish divergences on the RSI and MACD (not shown). Traders can long DOGE in case the price drops to $0.227 and the half-line of its pattern.